Brazilian E-Commerce Analytics Dashboard
This project was built as part of a Data Visualization & Analytics interview task. It demonstrates data modeling, insight generation, and storytelling skills using Power BI and a real-world dataset.
Project Overview
We used the Olist Brazilian E-Commerce dataset which contains over 100k orders from 2016 to 2018 (changed to 2019 - 2021). The dataset includes information about:
- Orders and order status
- Payments and installments
- Products and categories
- Sellers and customers (with geolocation)
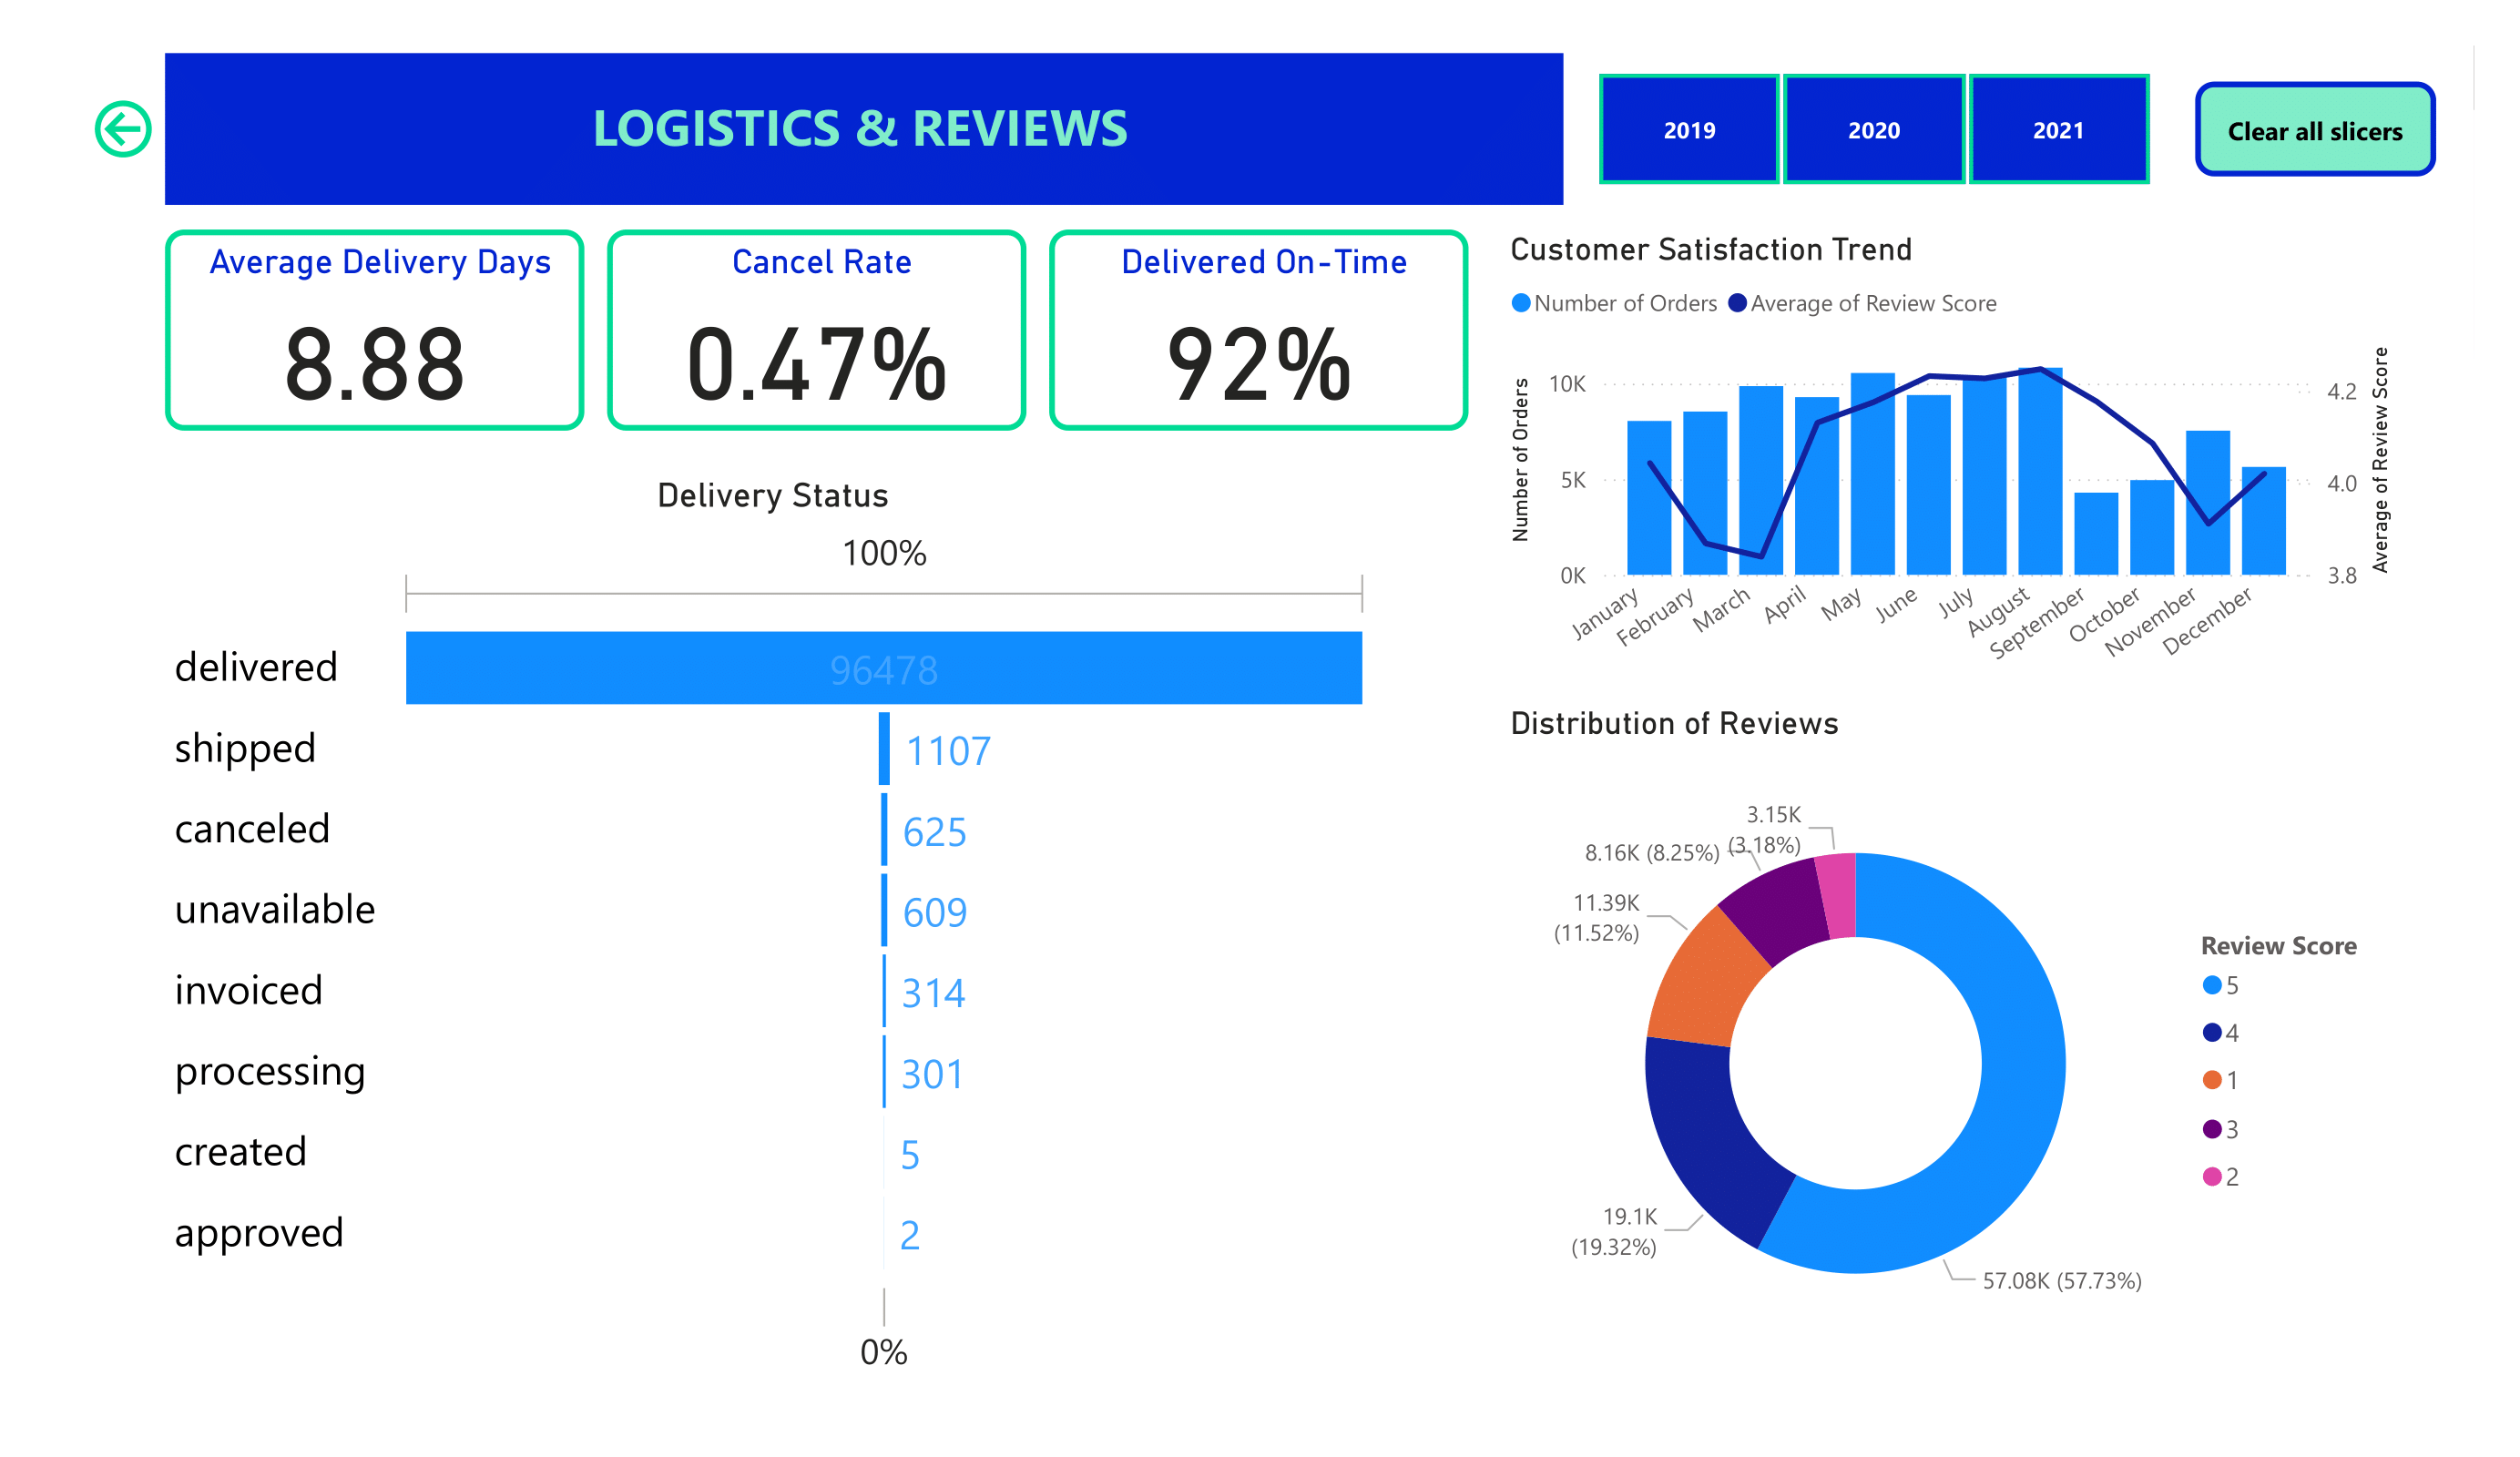
- Delivery performance (actual vs. estimated)
- Customer reviews and satisfaction scores
- Website analytics (visits, sources, ad clicks)
Goal:
To build an executive-level dashboard (company health), a tactical dashboard (website performance), and generate three key business insights supported by data.
Key Tasks
1. Data Modeling
- Combined multiple CSV files (Orders, Items, Payments, Reviews, Customers, Sellers, Products, Geolocation, Website analytics).
- Created a star schema with
olist_orders as the central fact table.
- Added a Date dimension for time intelligence.
- Cleaned and transformed data (handled missing/invalid values, converted time formats).
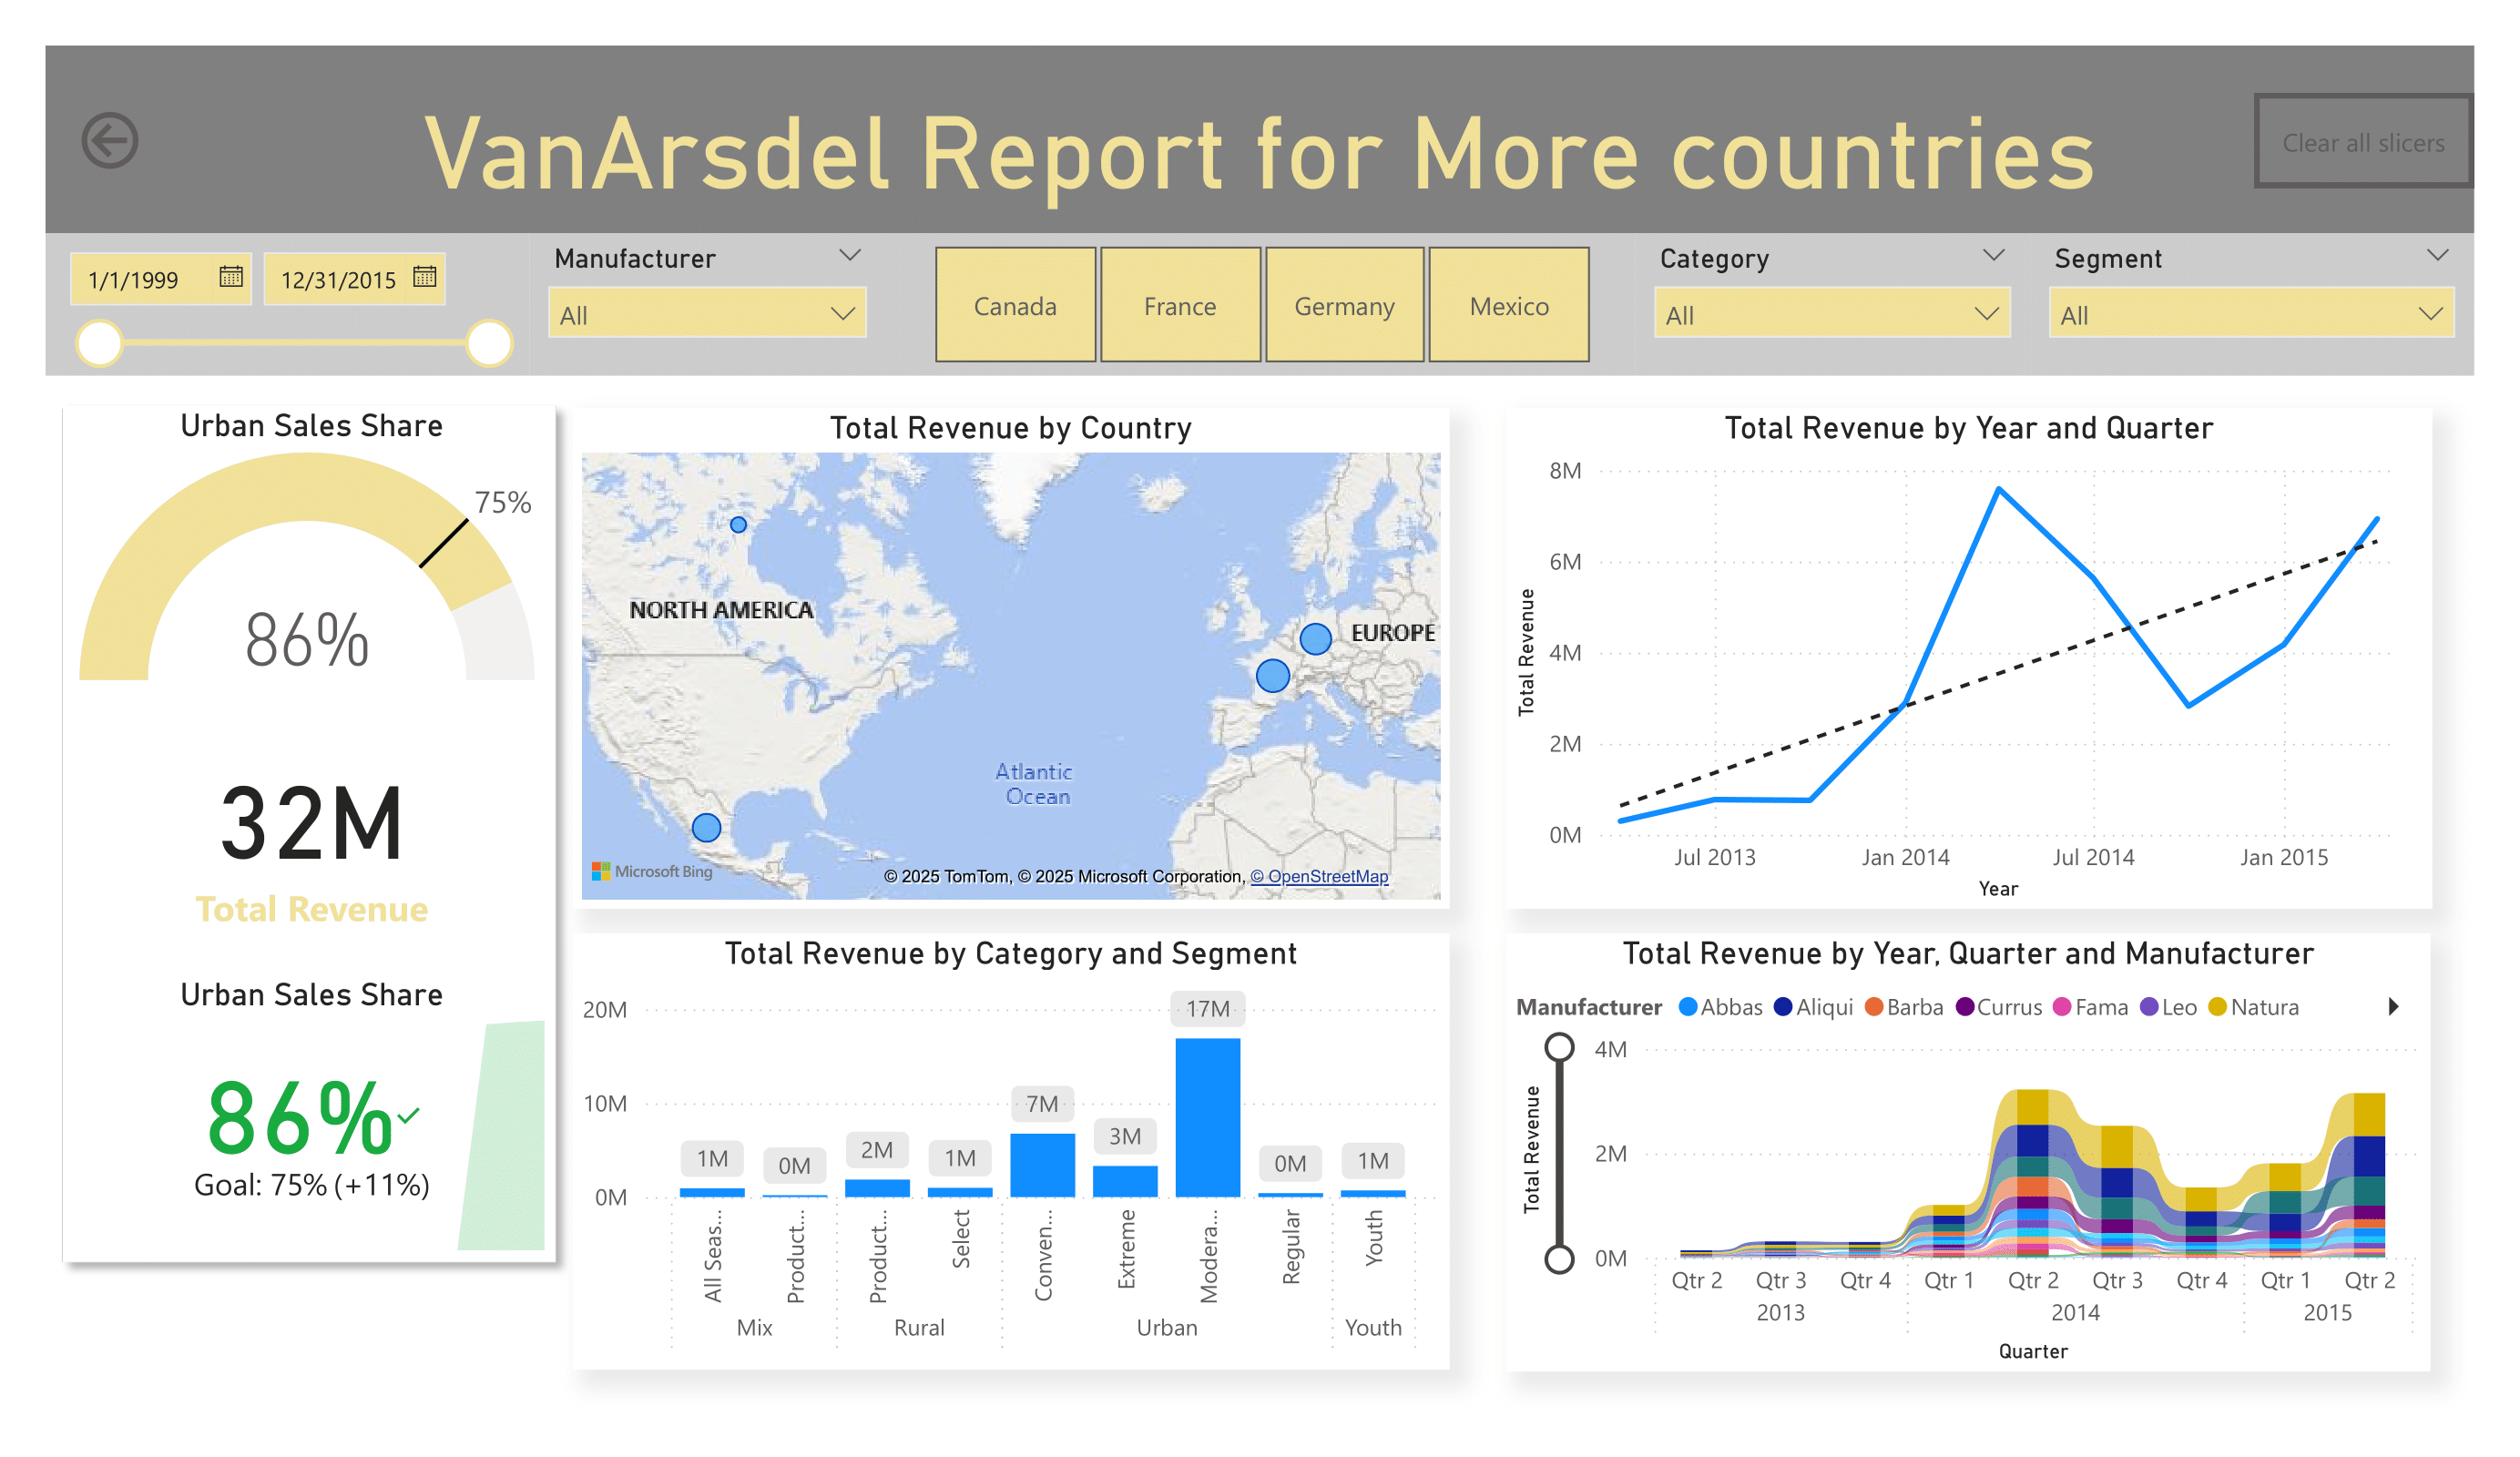
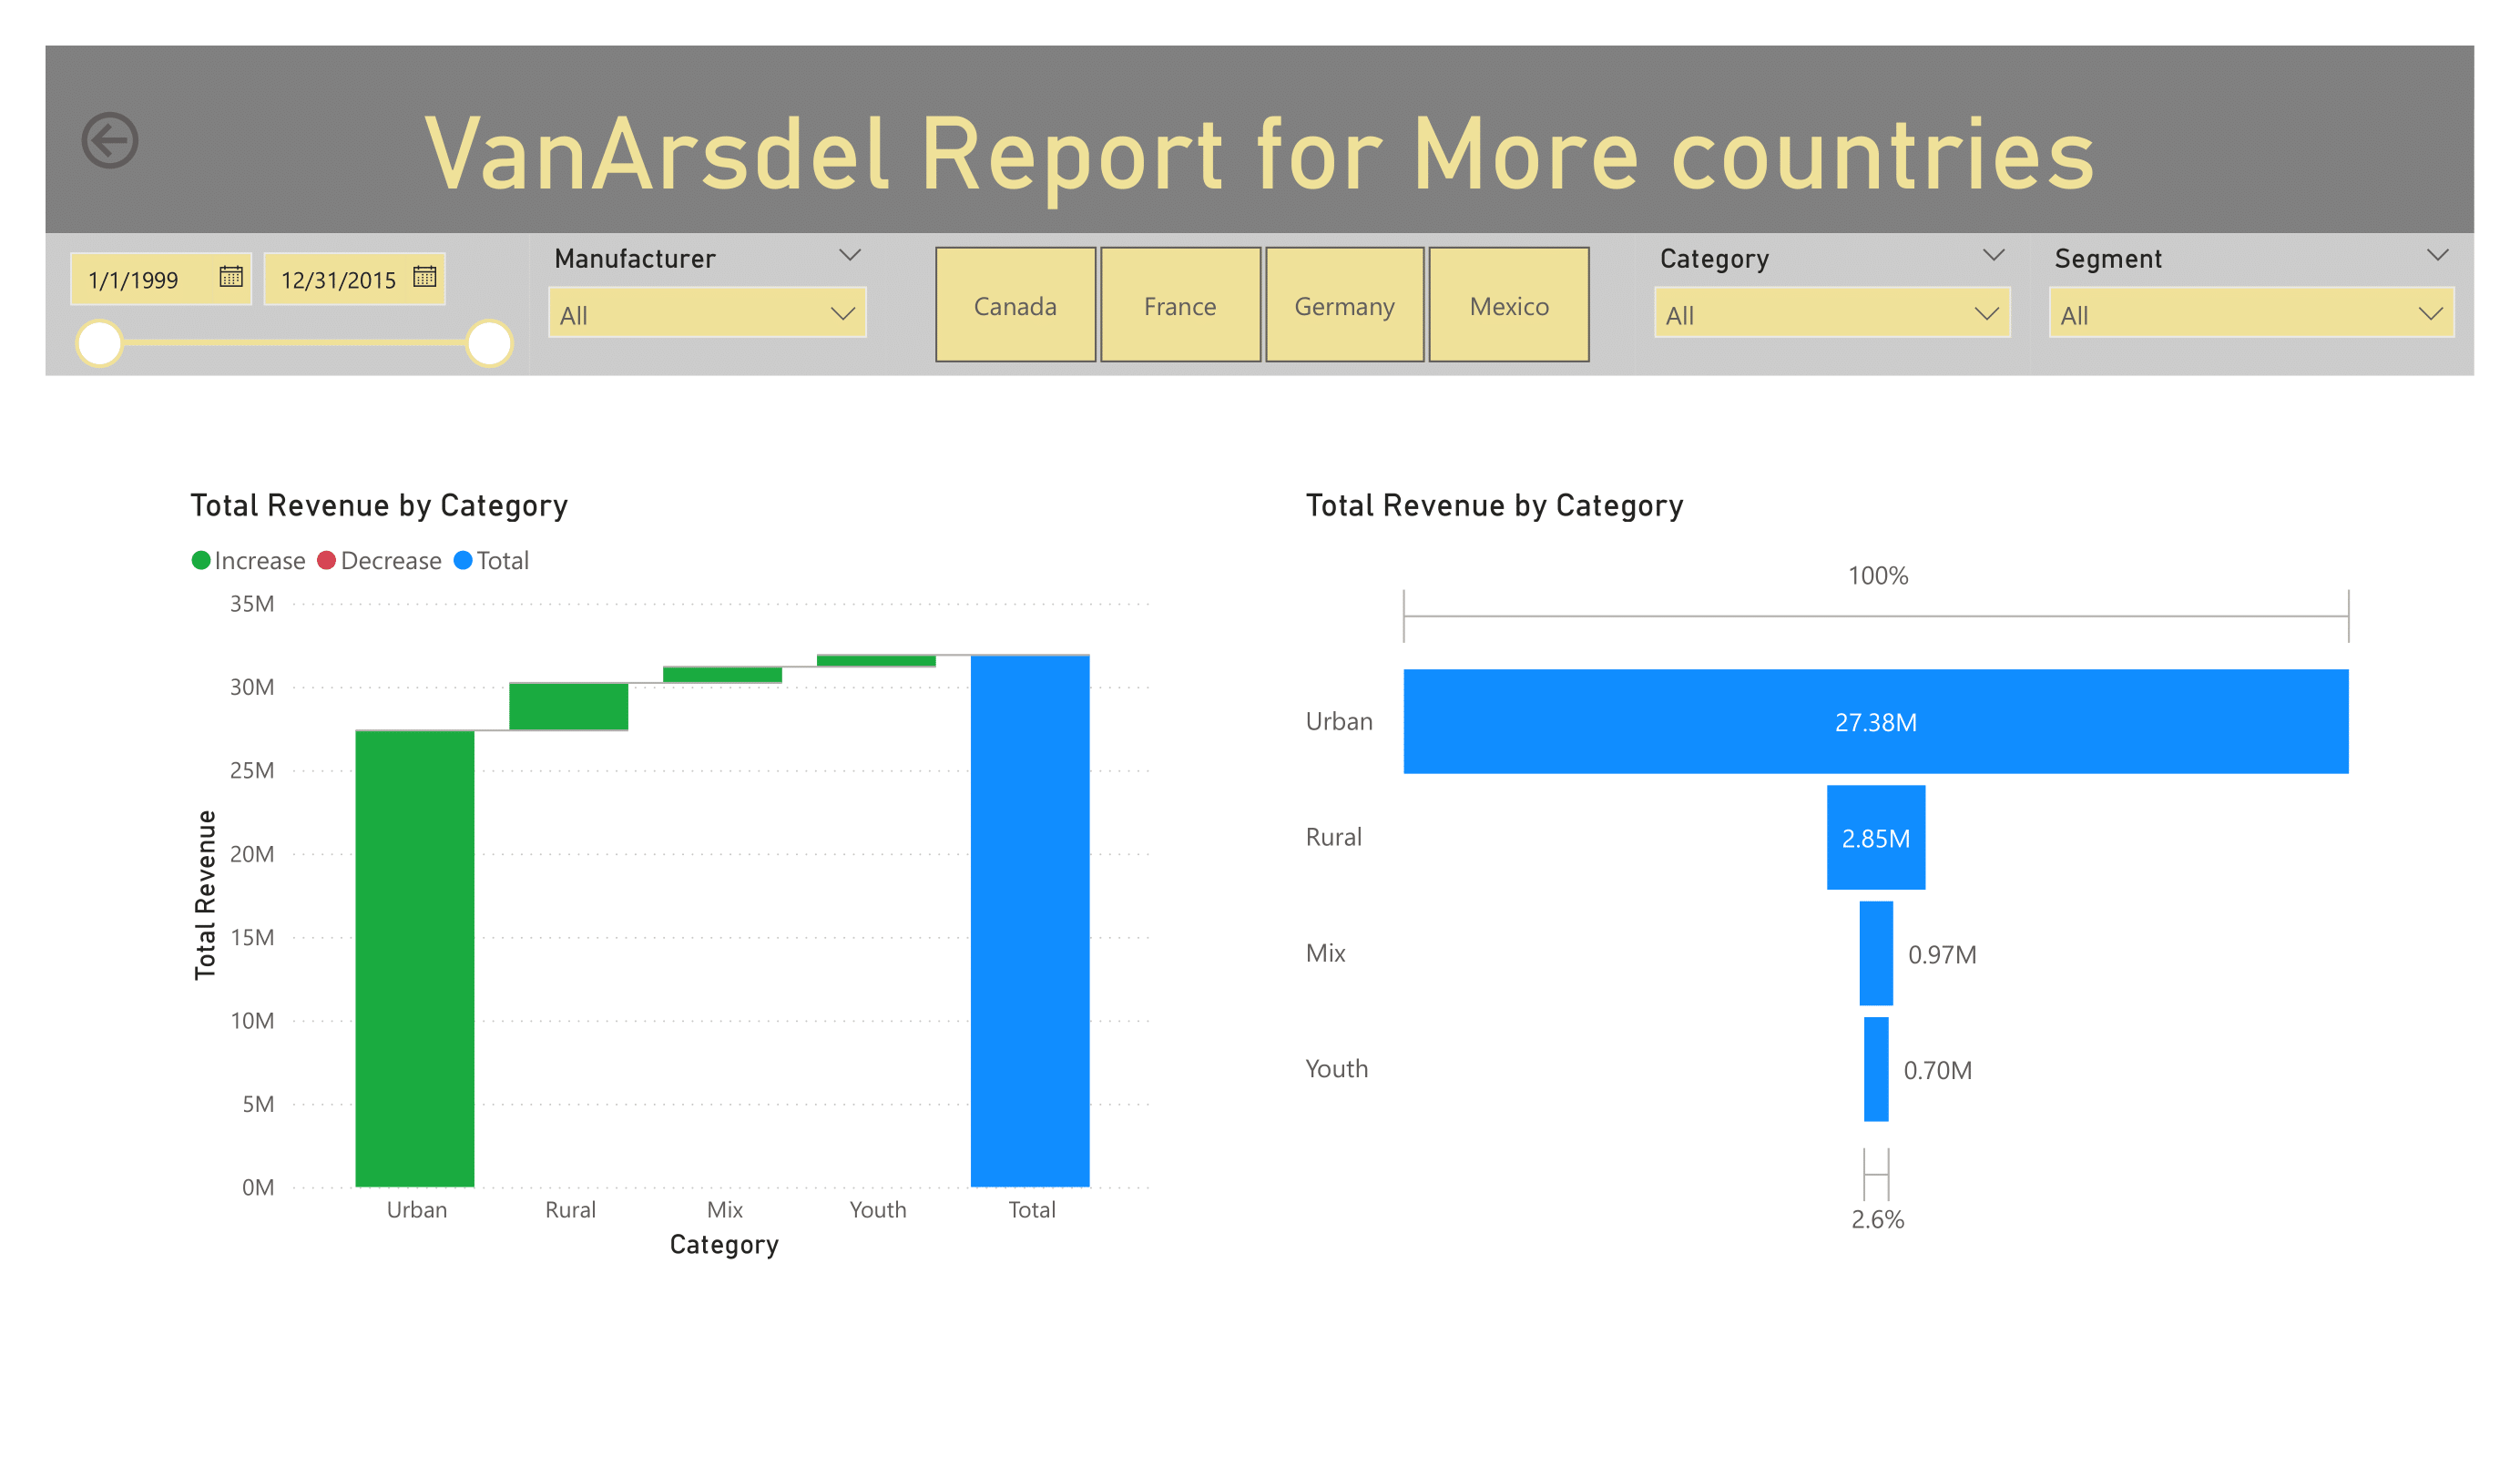
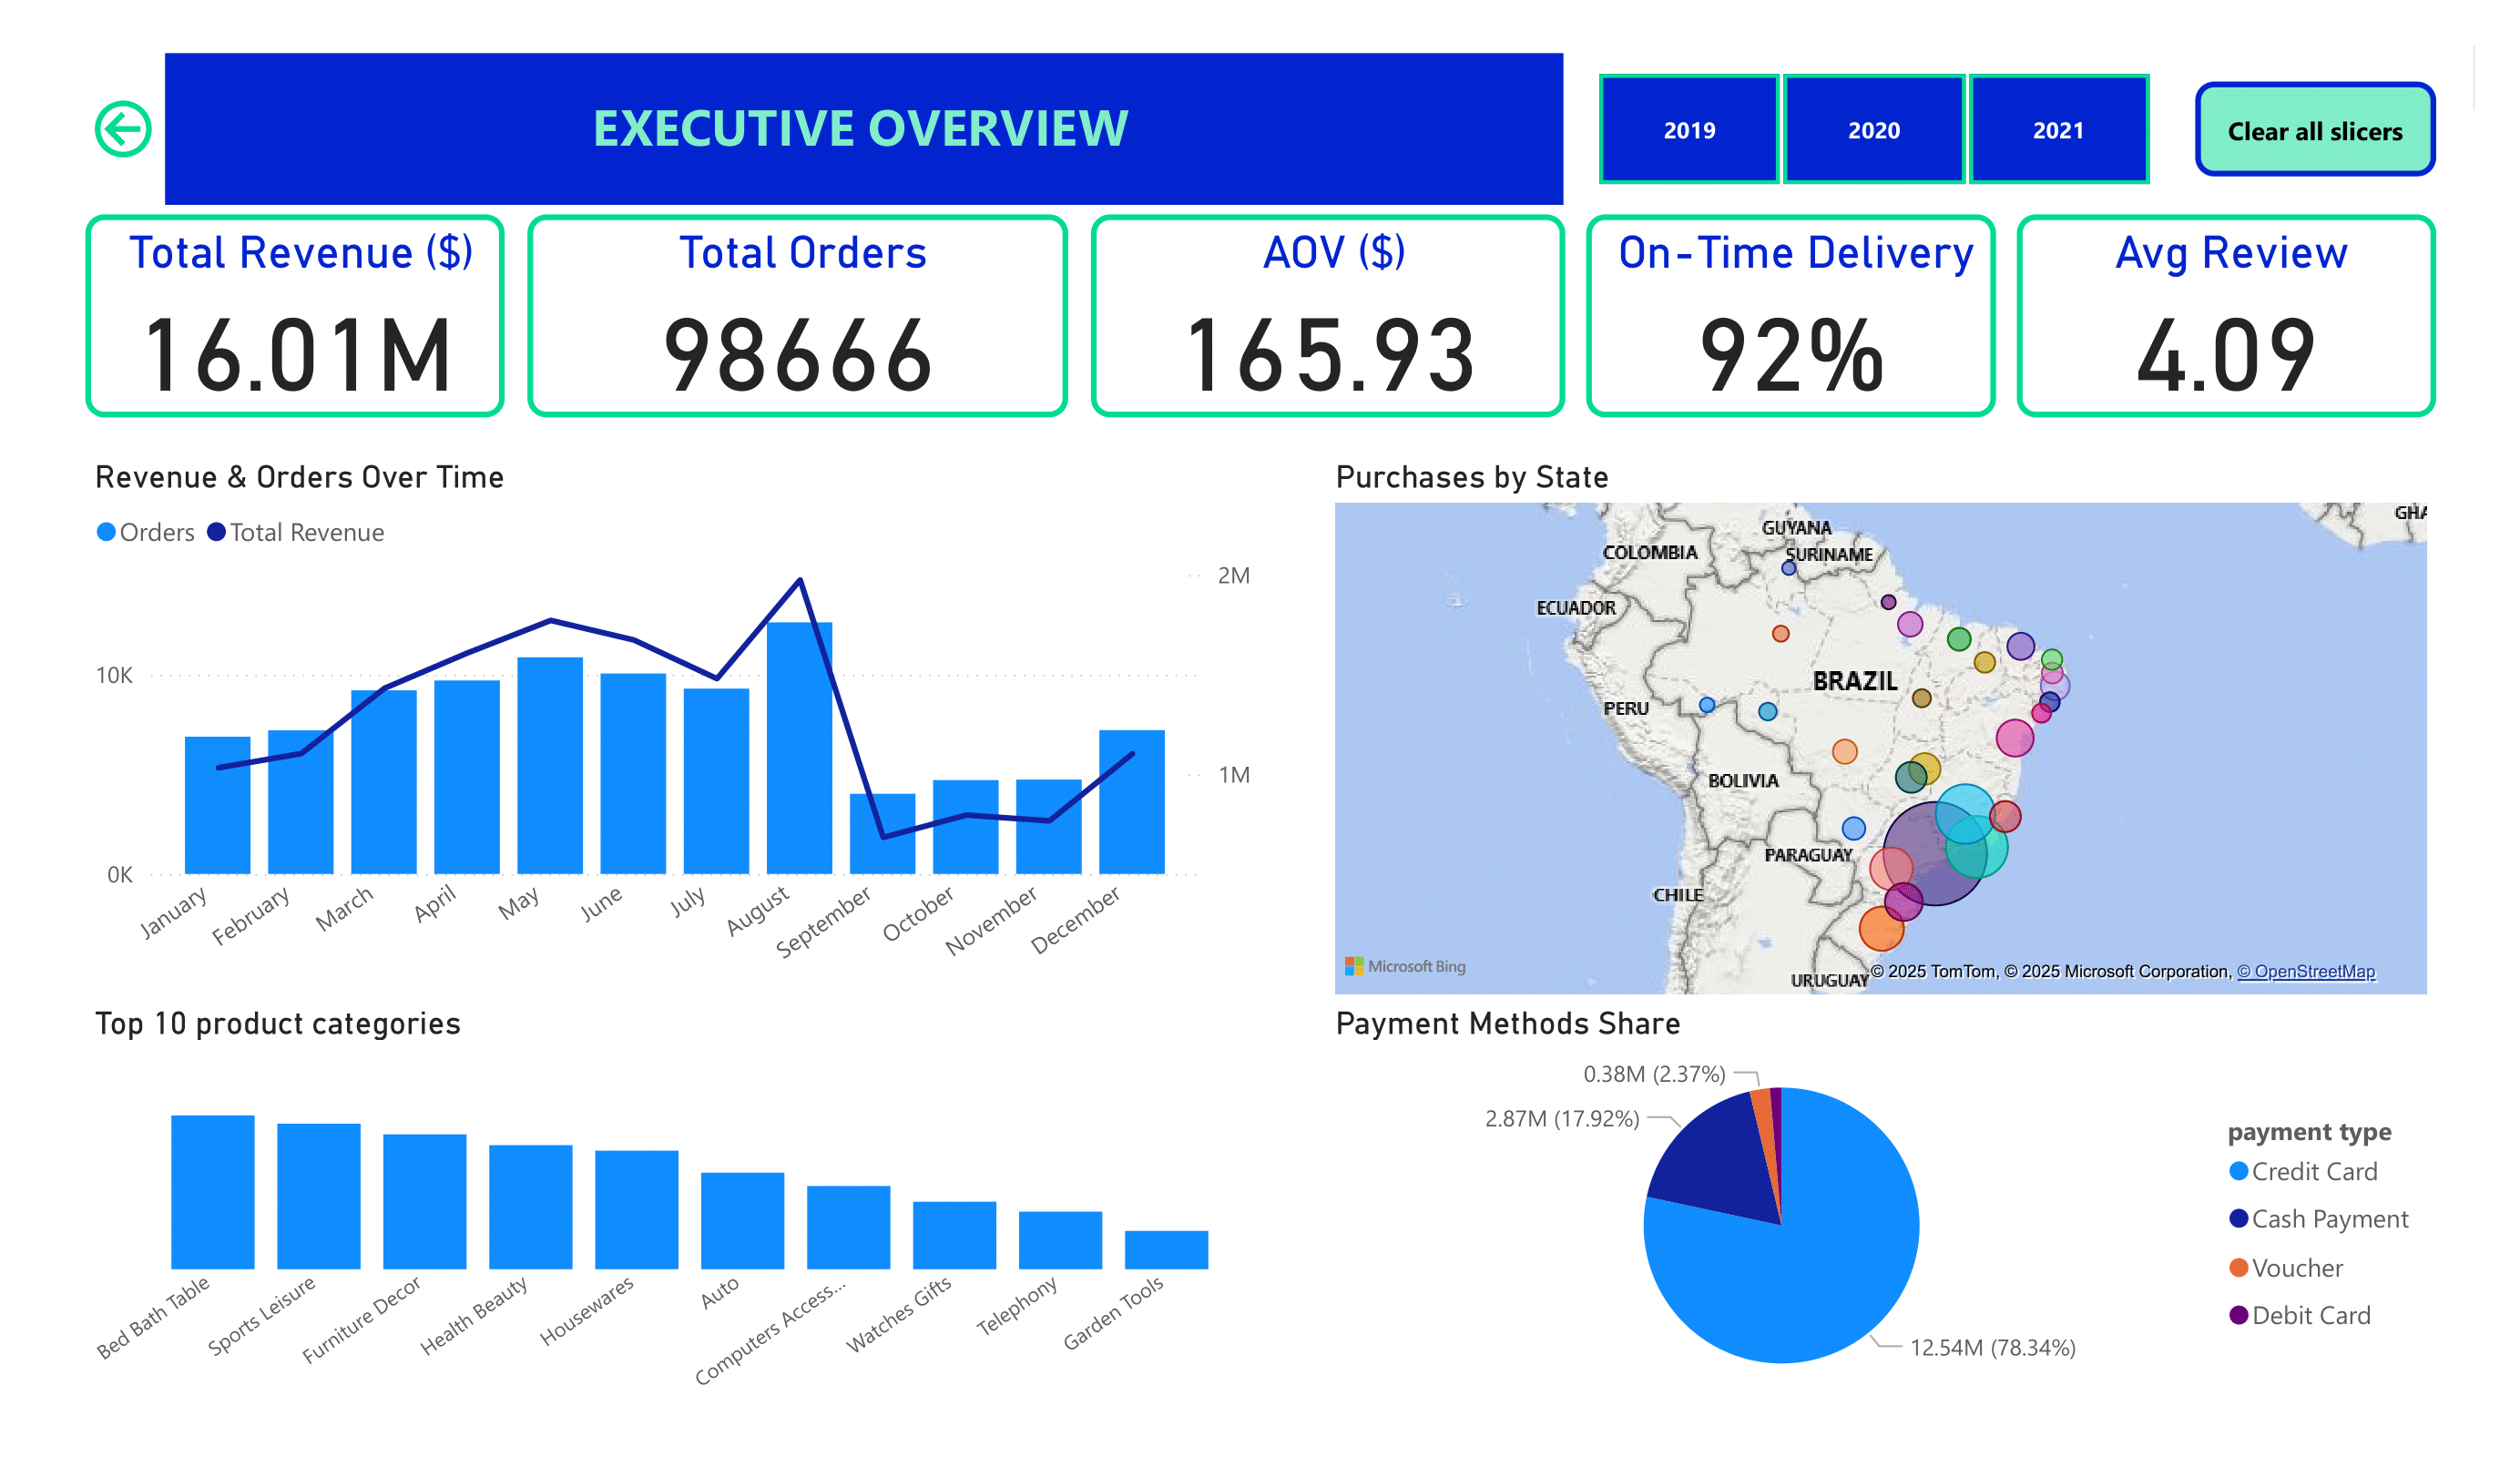
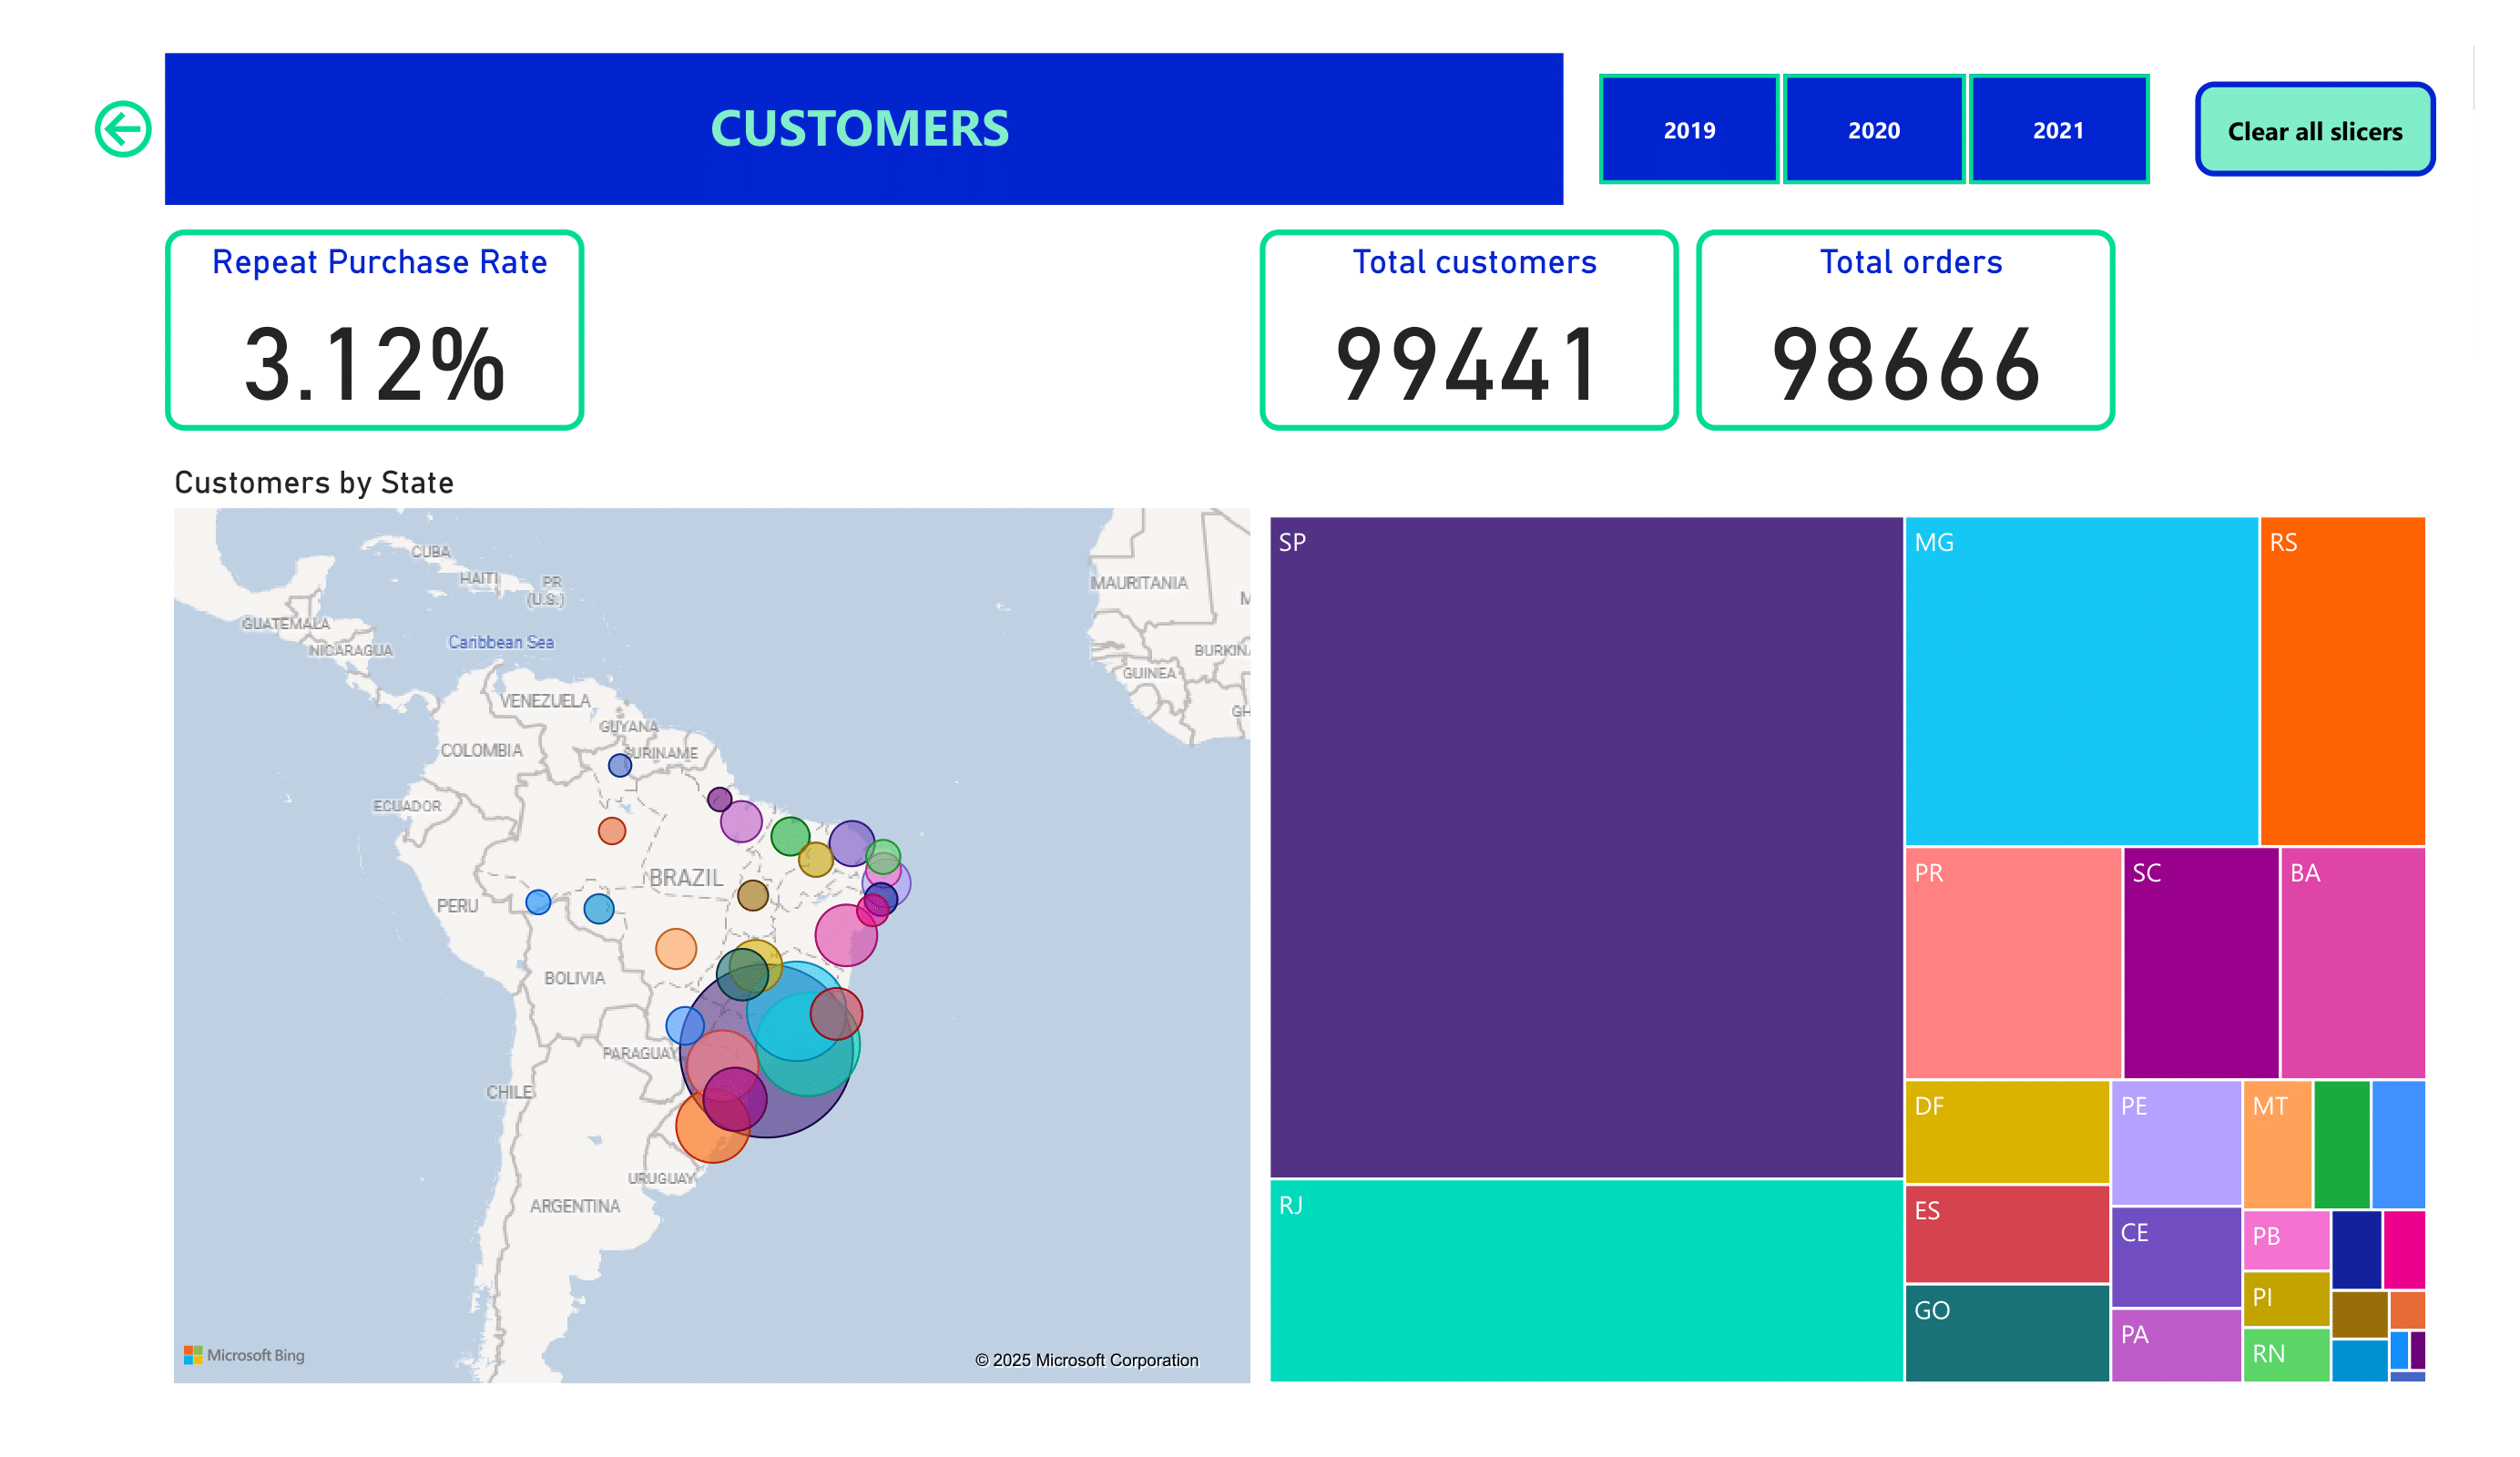
2. Executive Dashboard
KPIs and visuals built for C-level stakeholders:
- Total Revenue, Orders, Average Order Value
- On-time Delivery %, Avg. Review Score
- Orders & Revenue trend over time
- Map: Orders by State
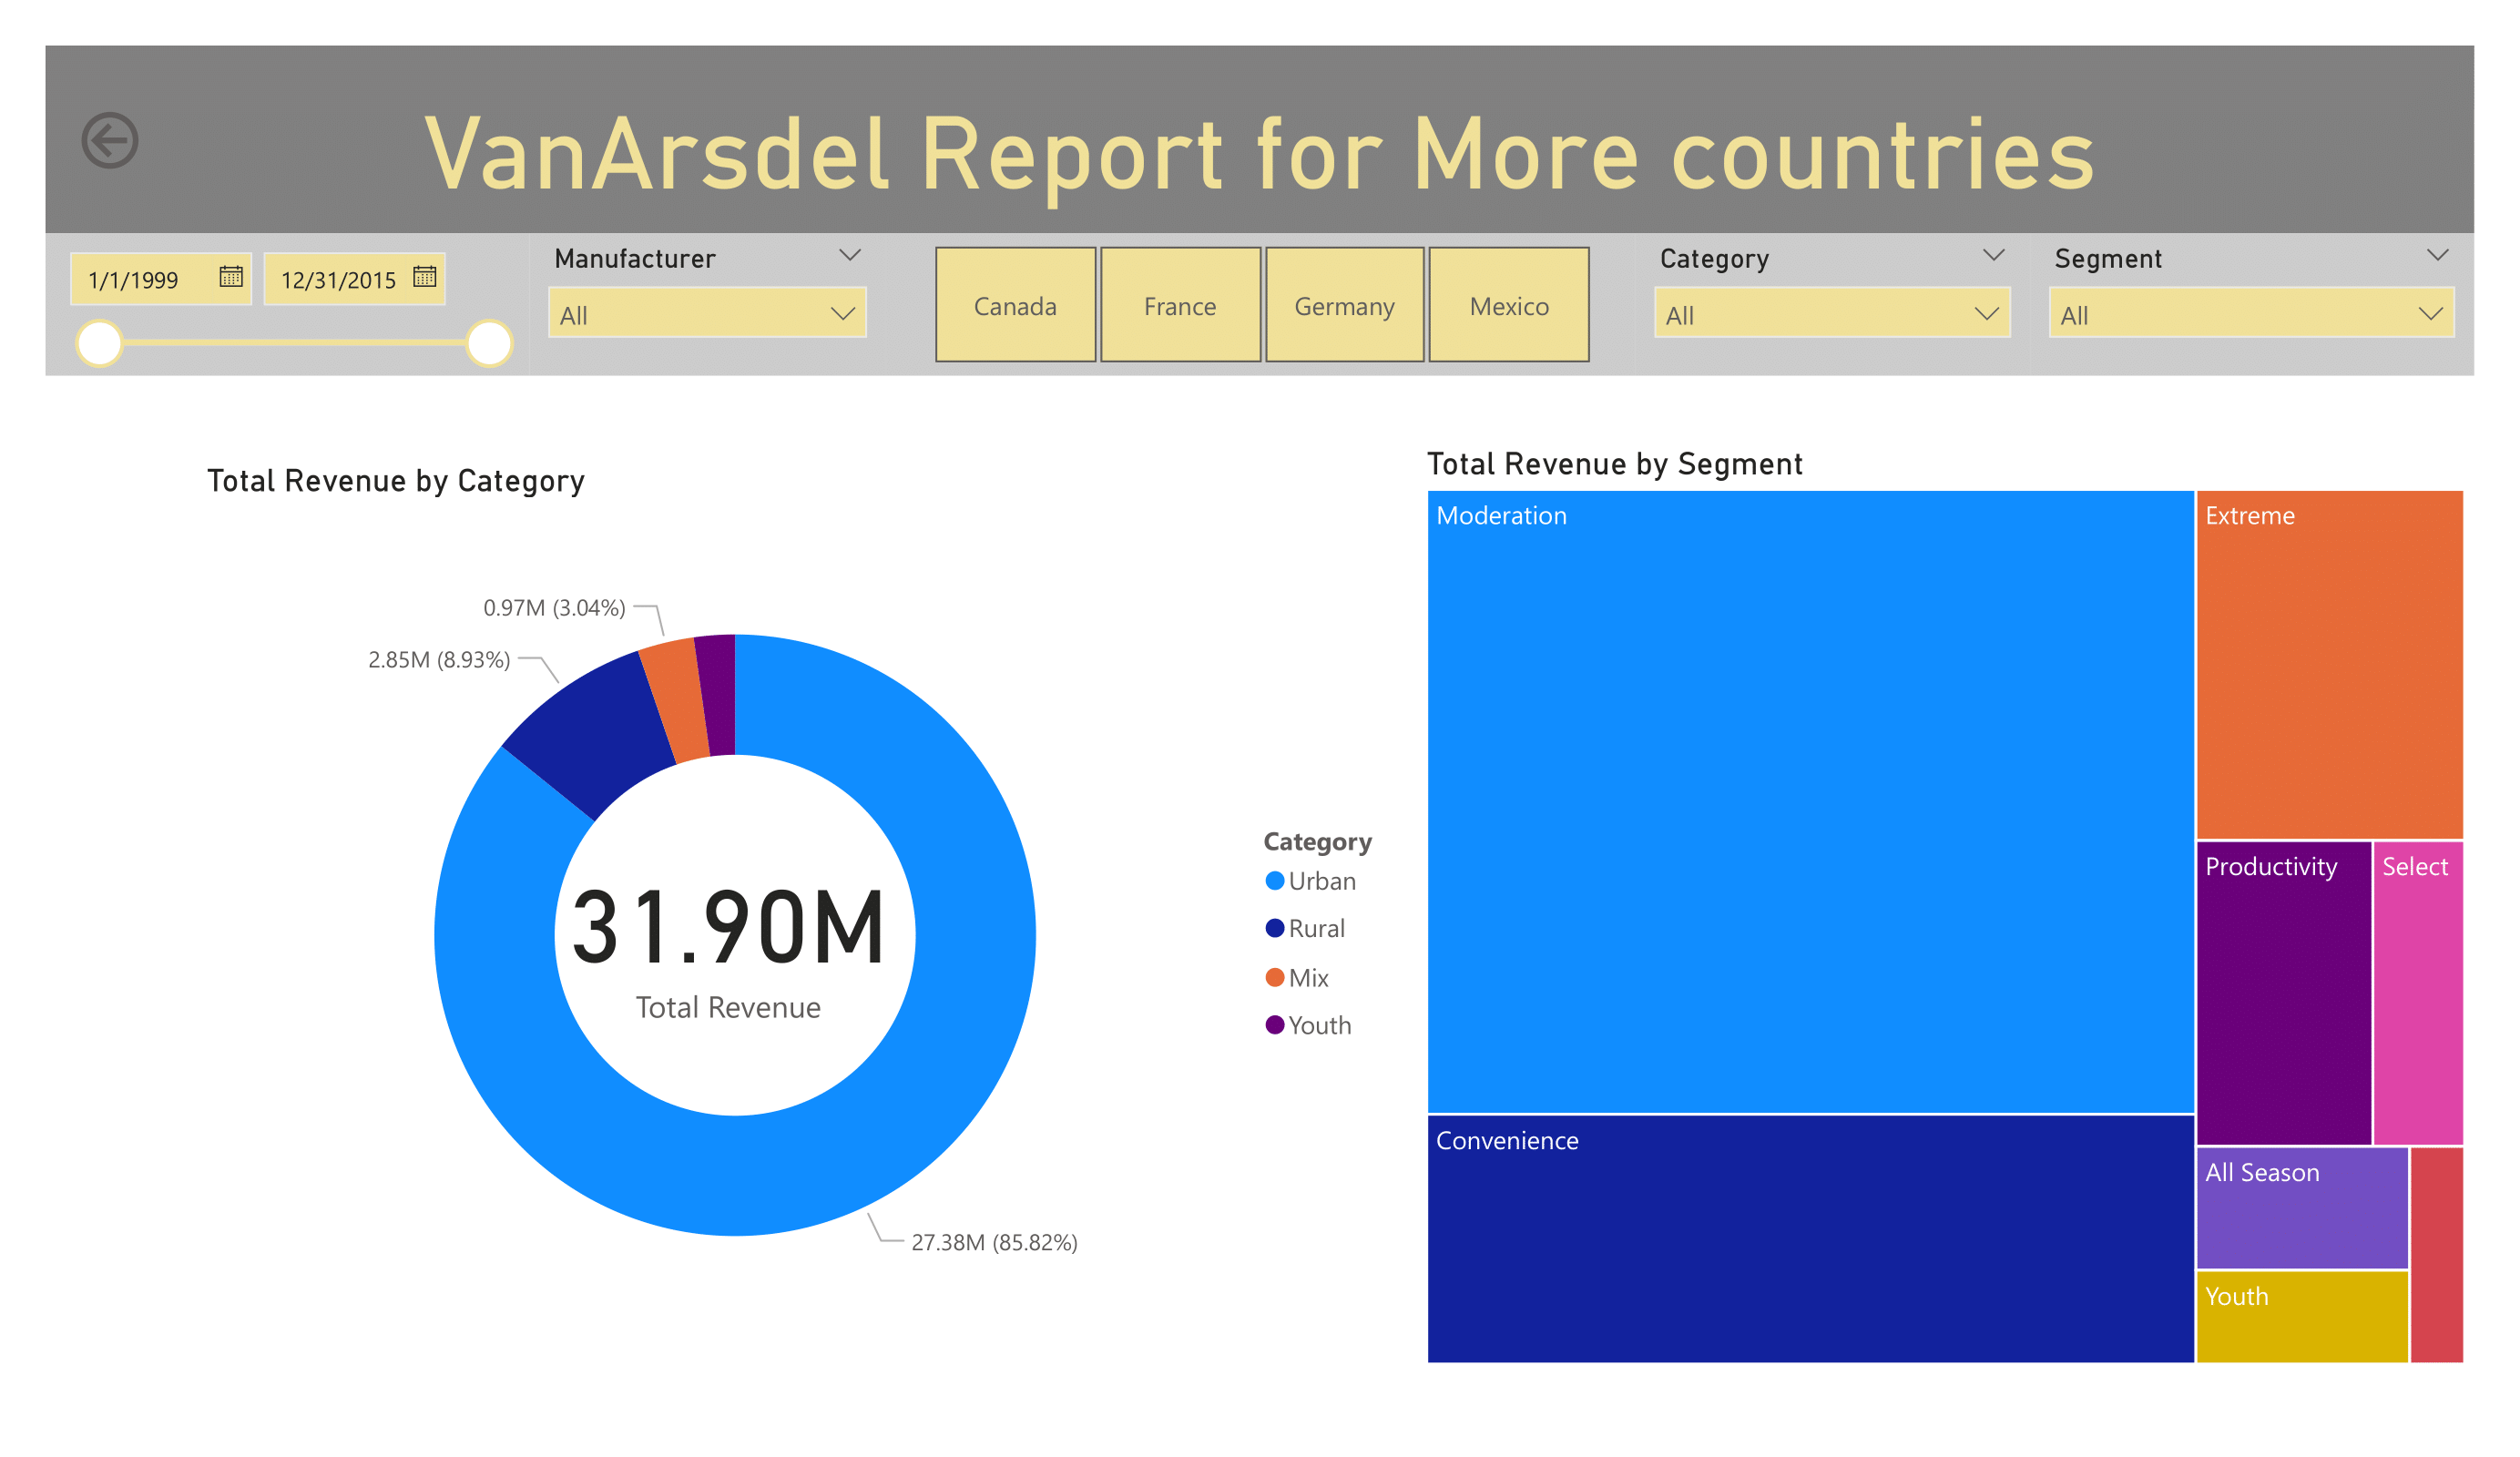
- Top product categories & payment methods
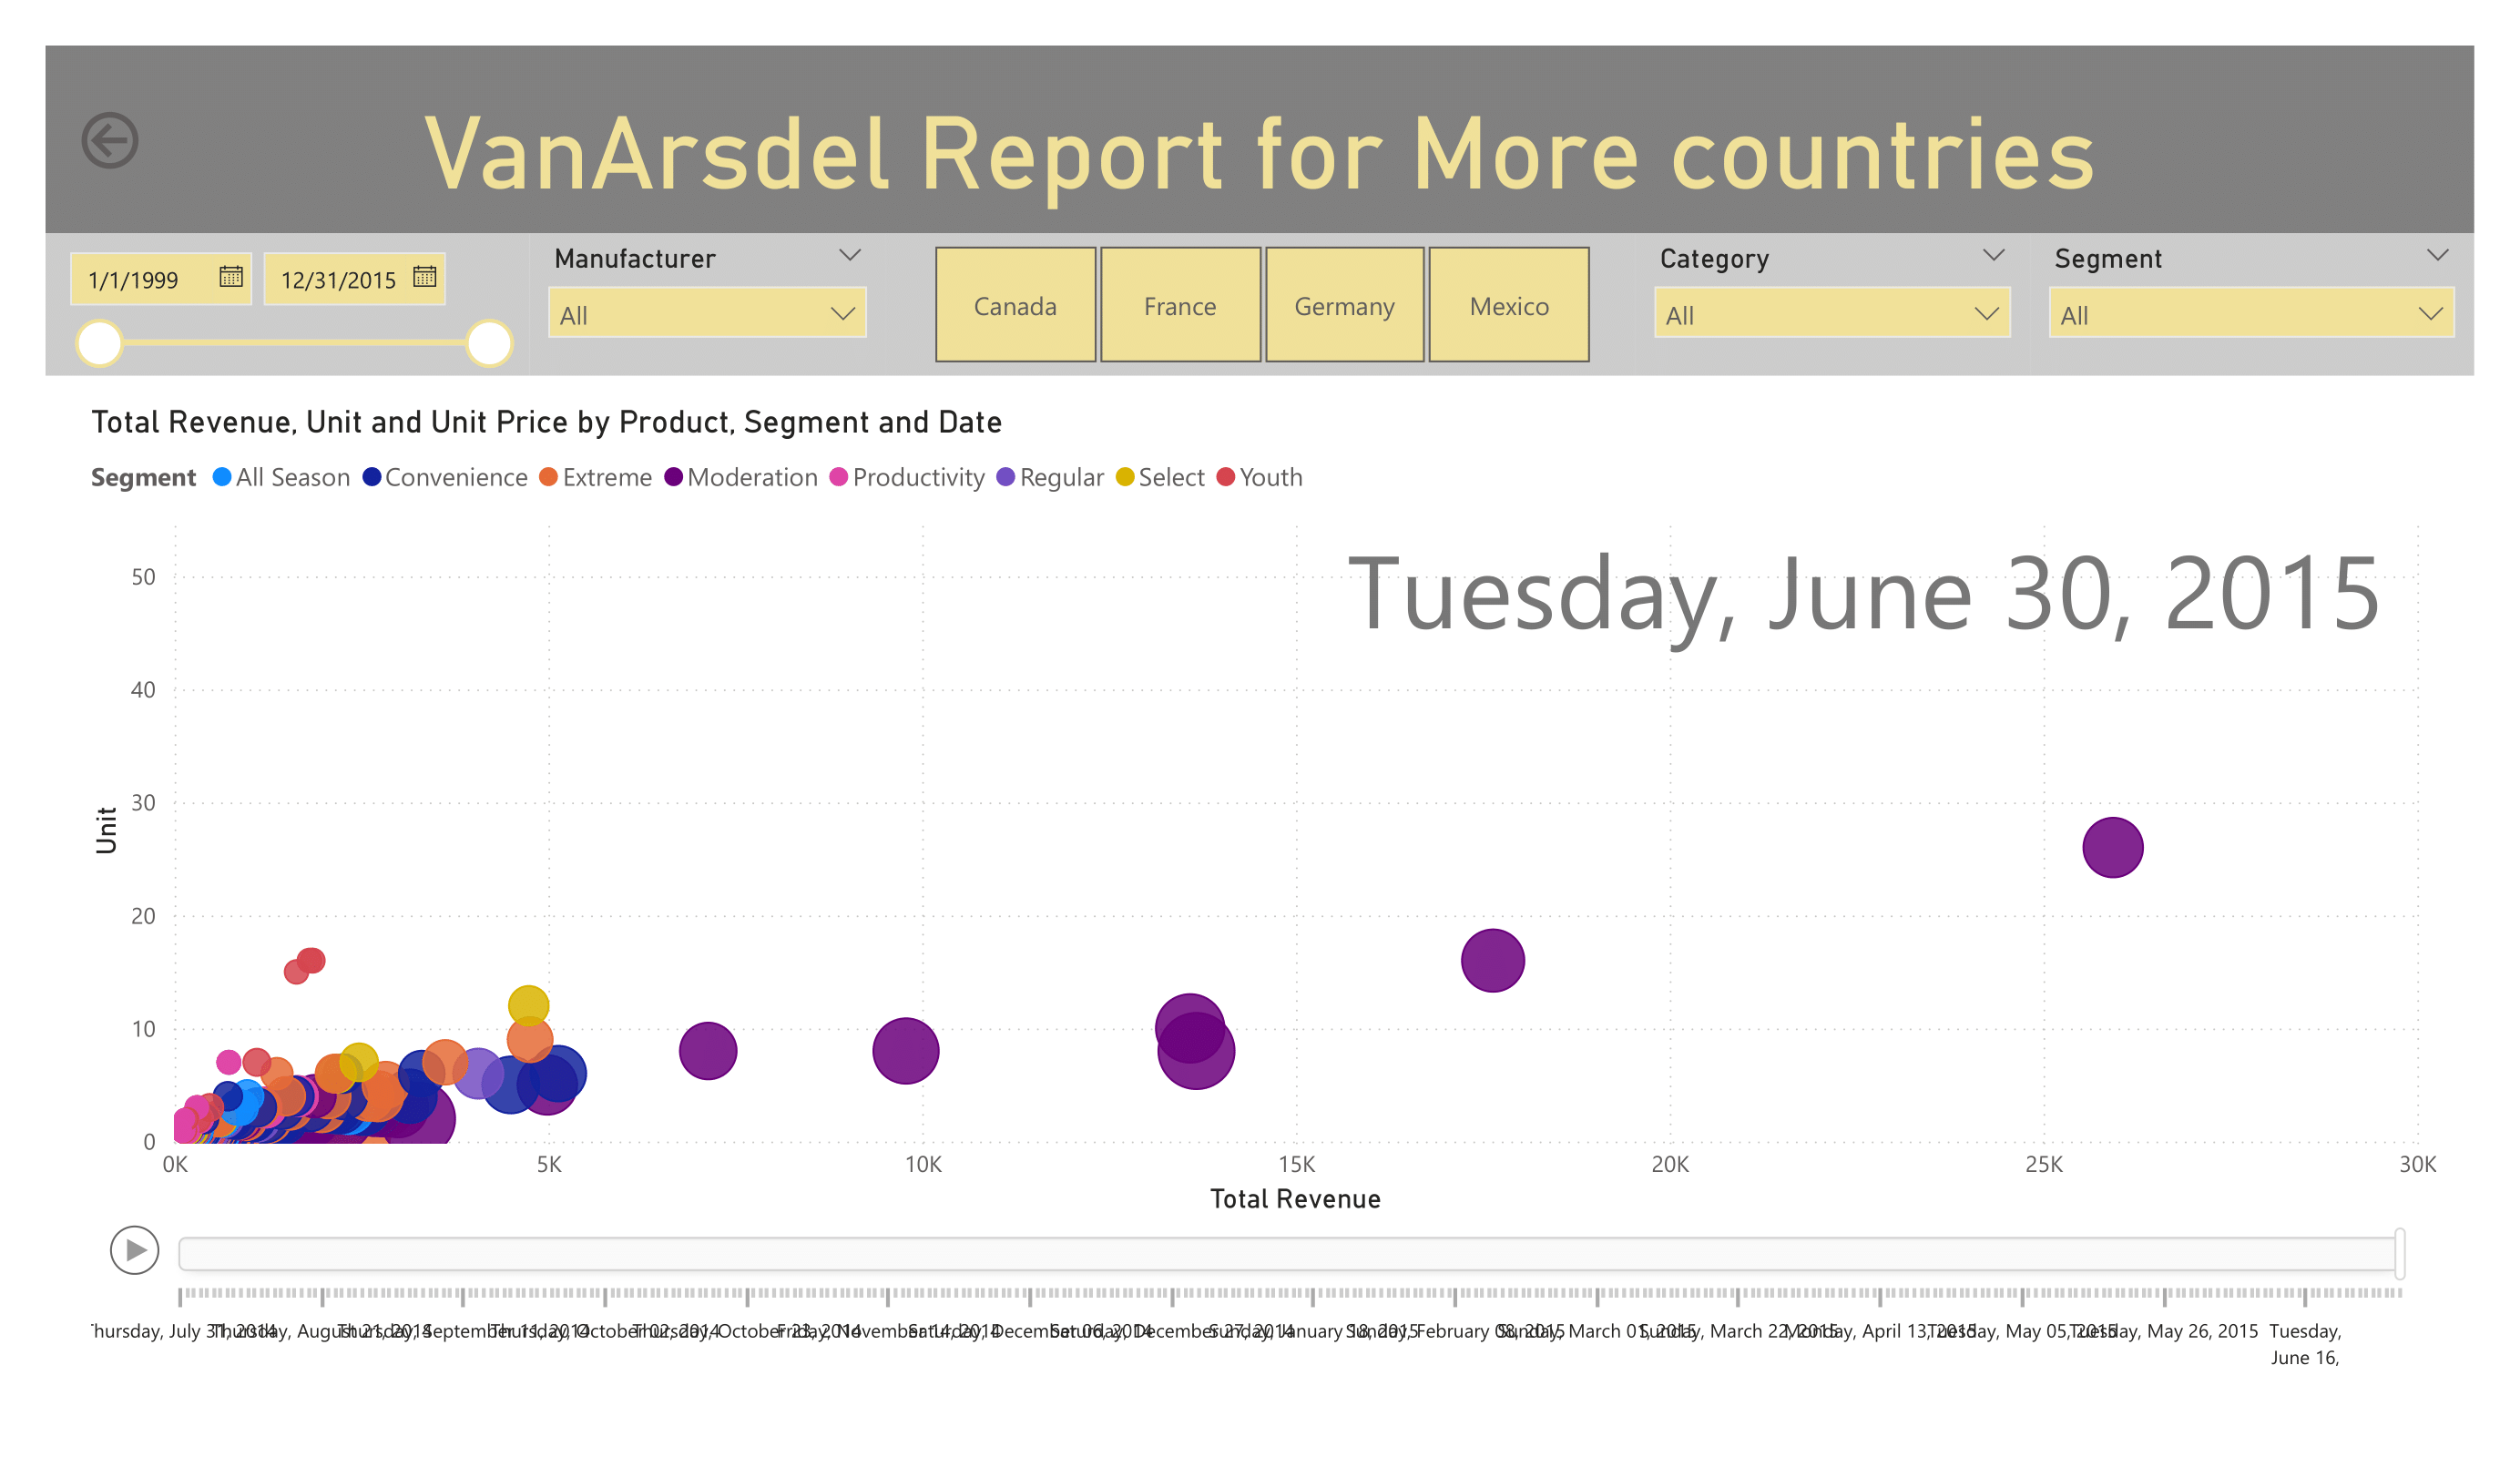
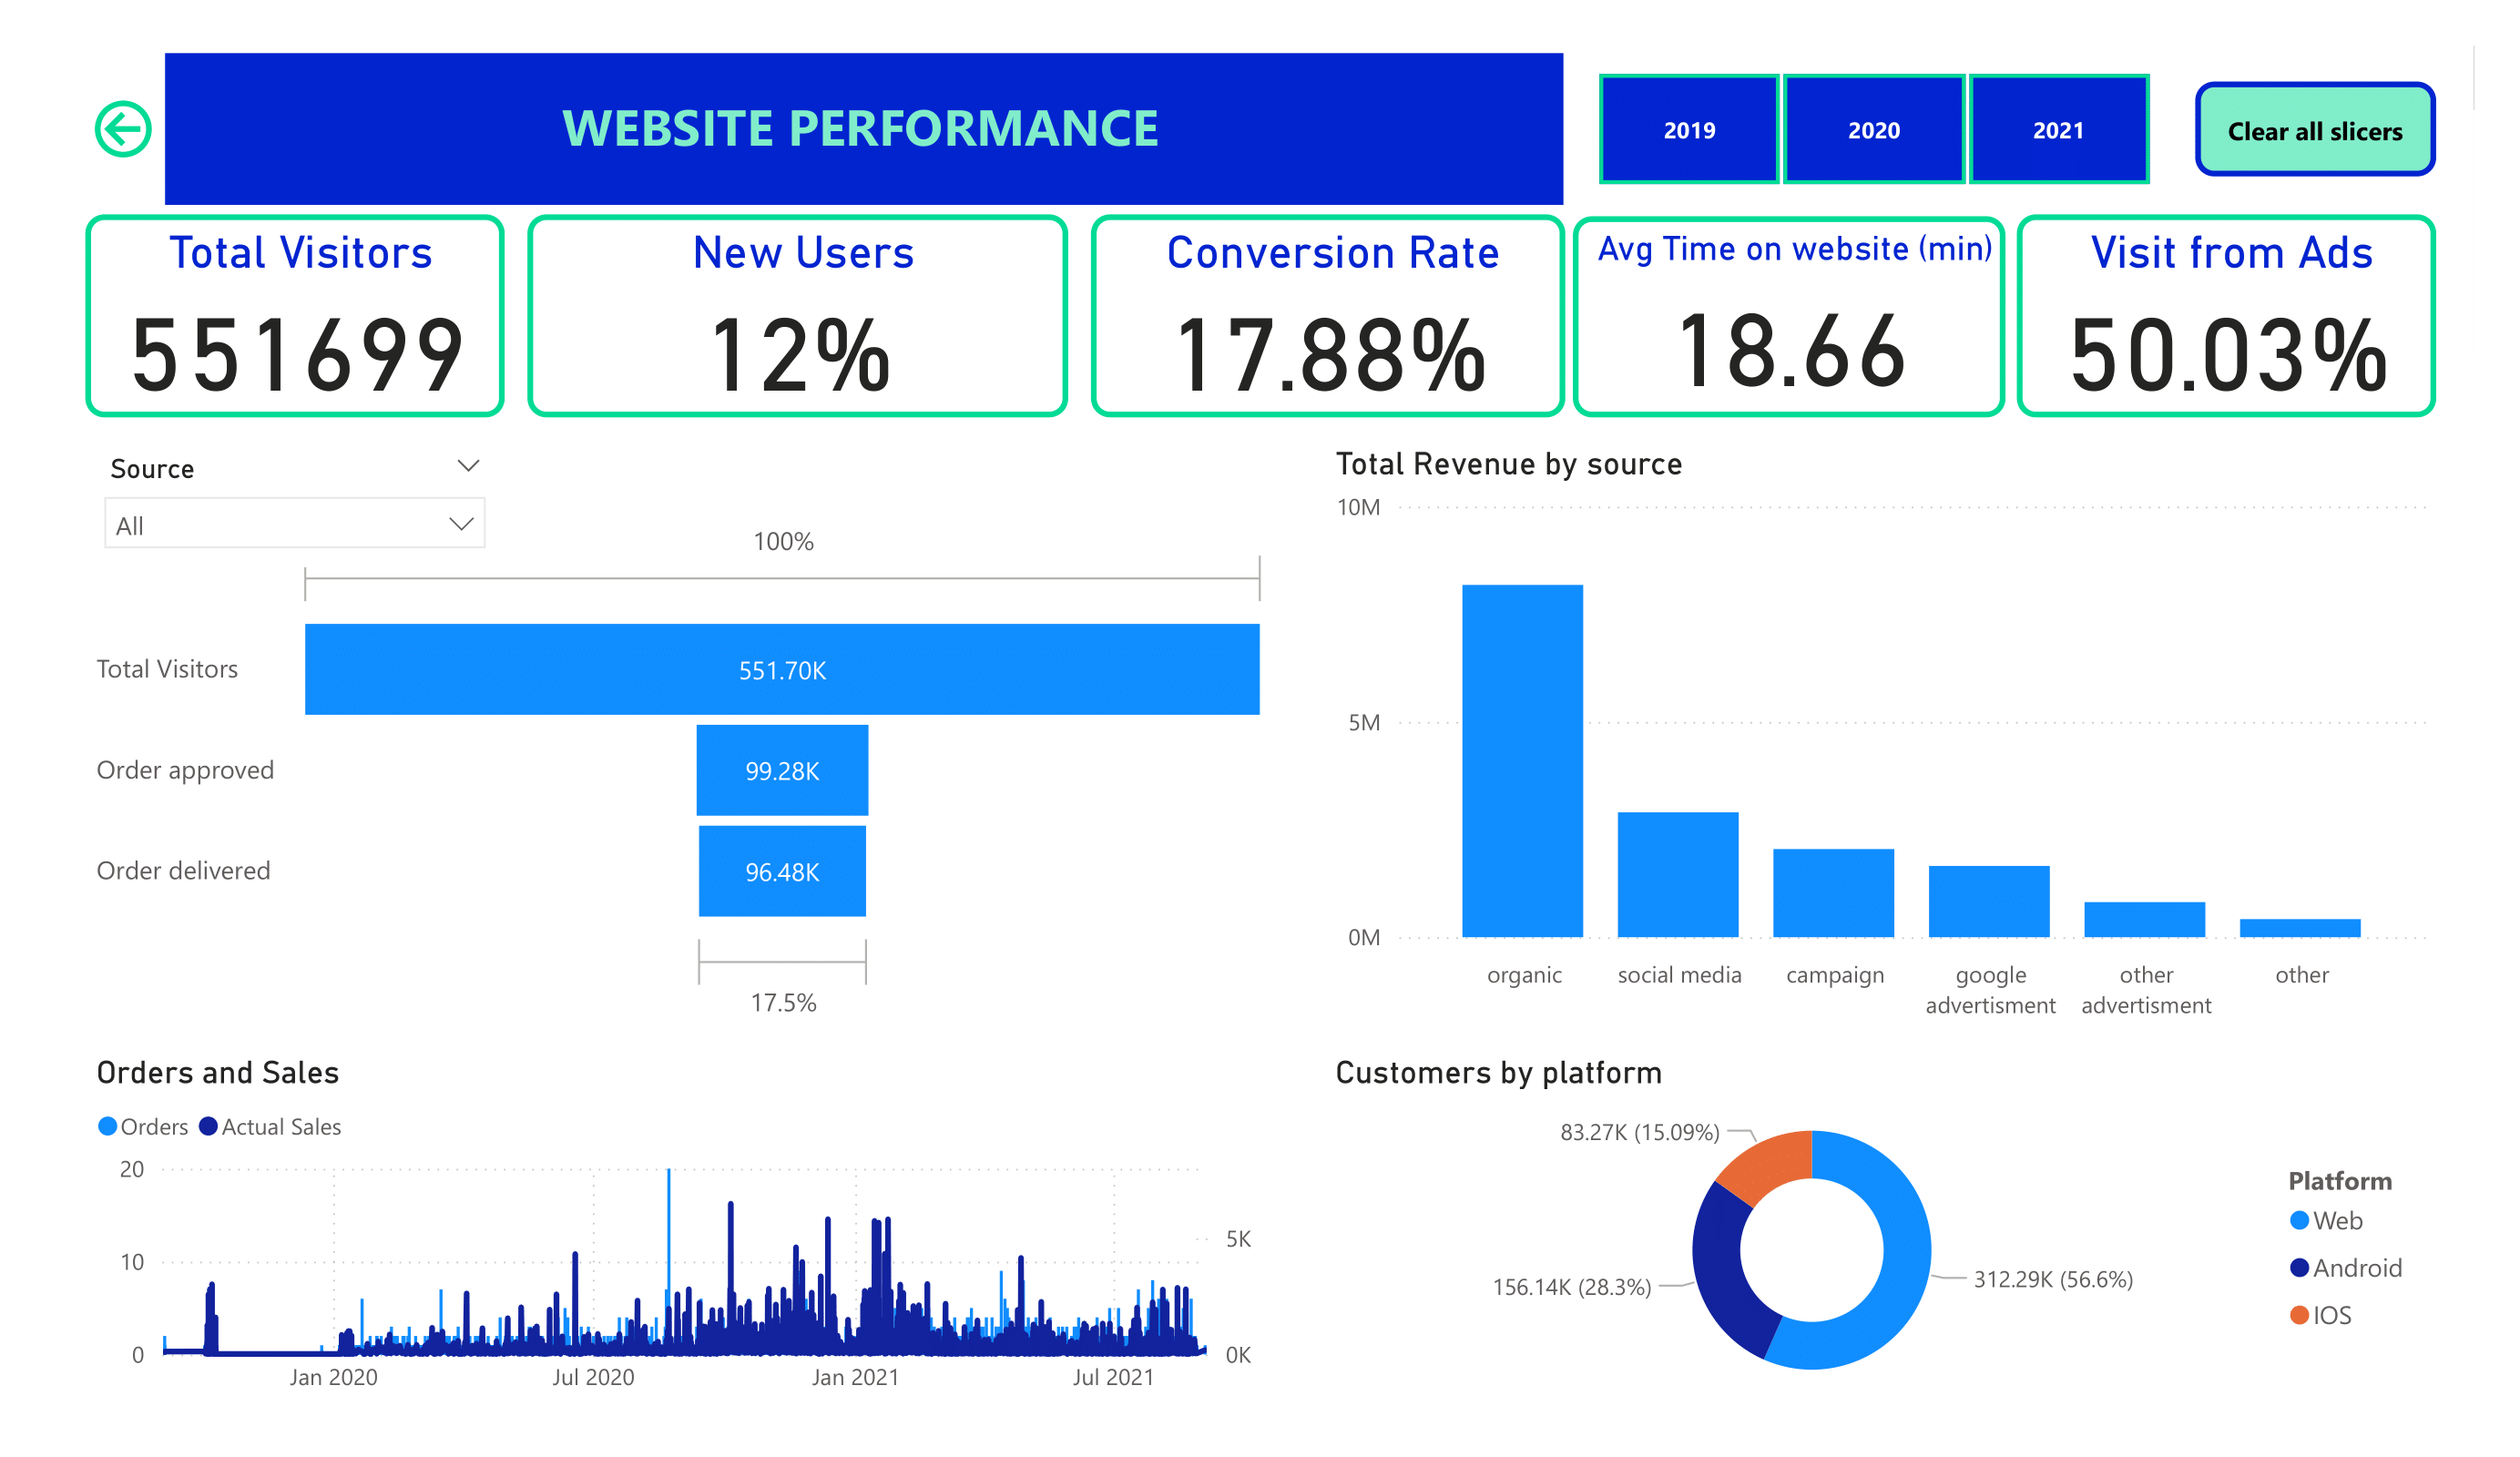
3. Tactical Dashboard
Focused on website performance and user acquisition:
- New vs Returning visitors
- Conversion funnel: Visitors → Clicks → Orders → Revenue
- Average time on site, ad click performance
- Revenue per traffic source and platform
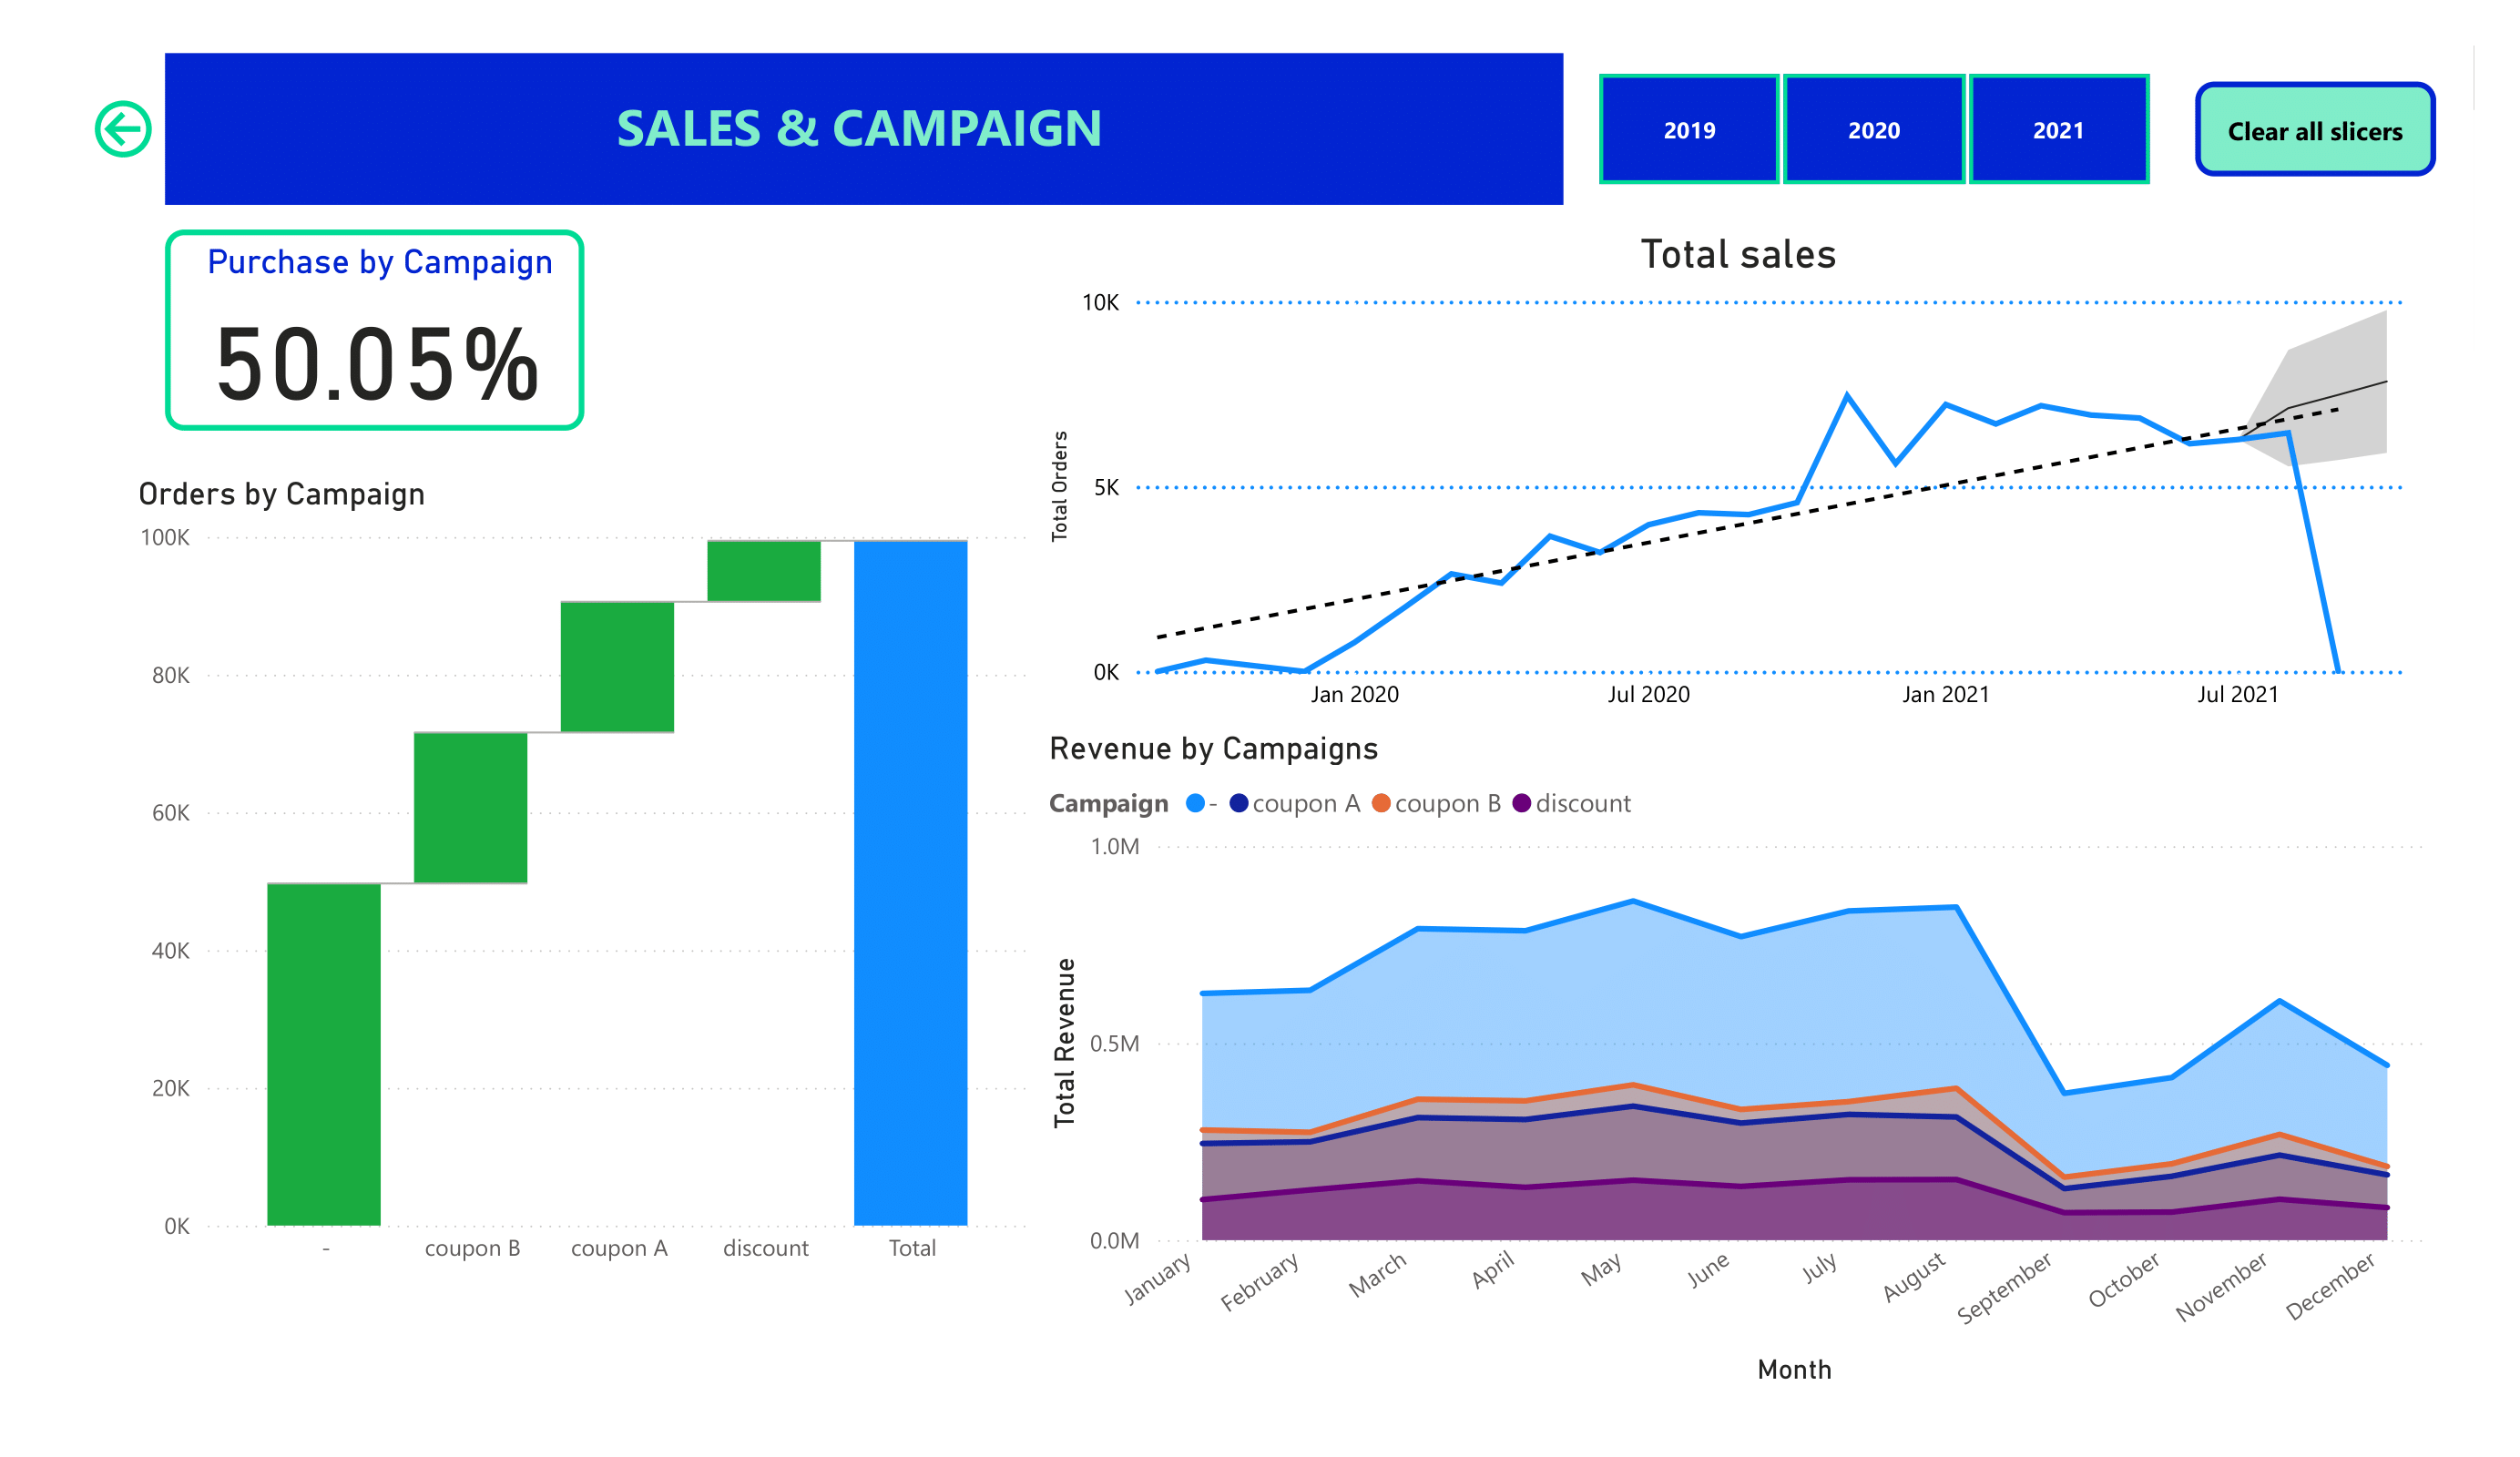
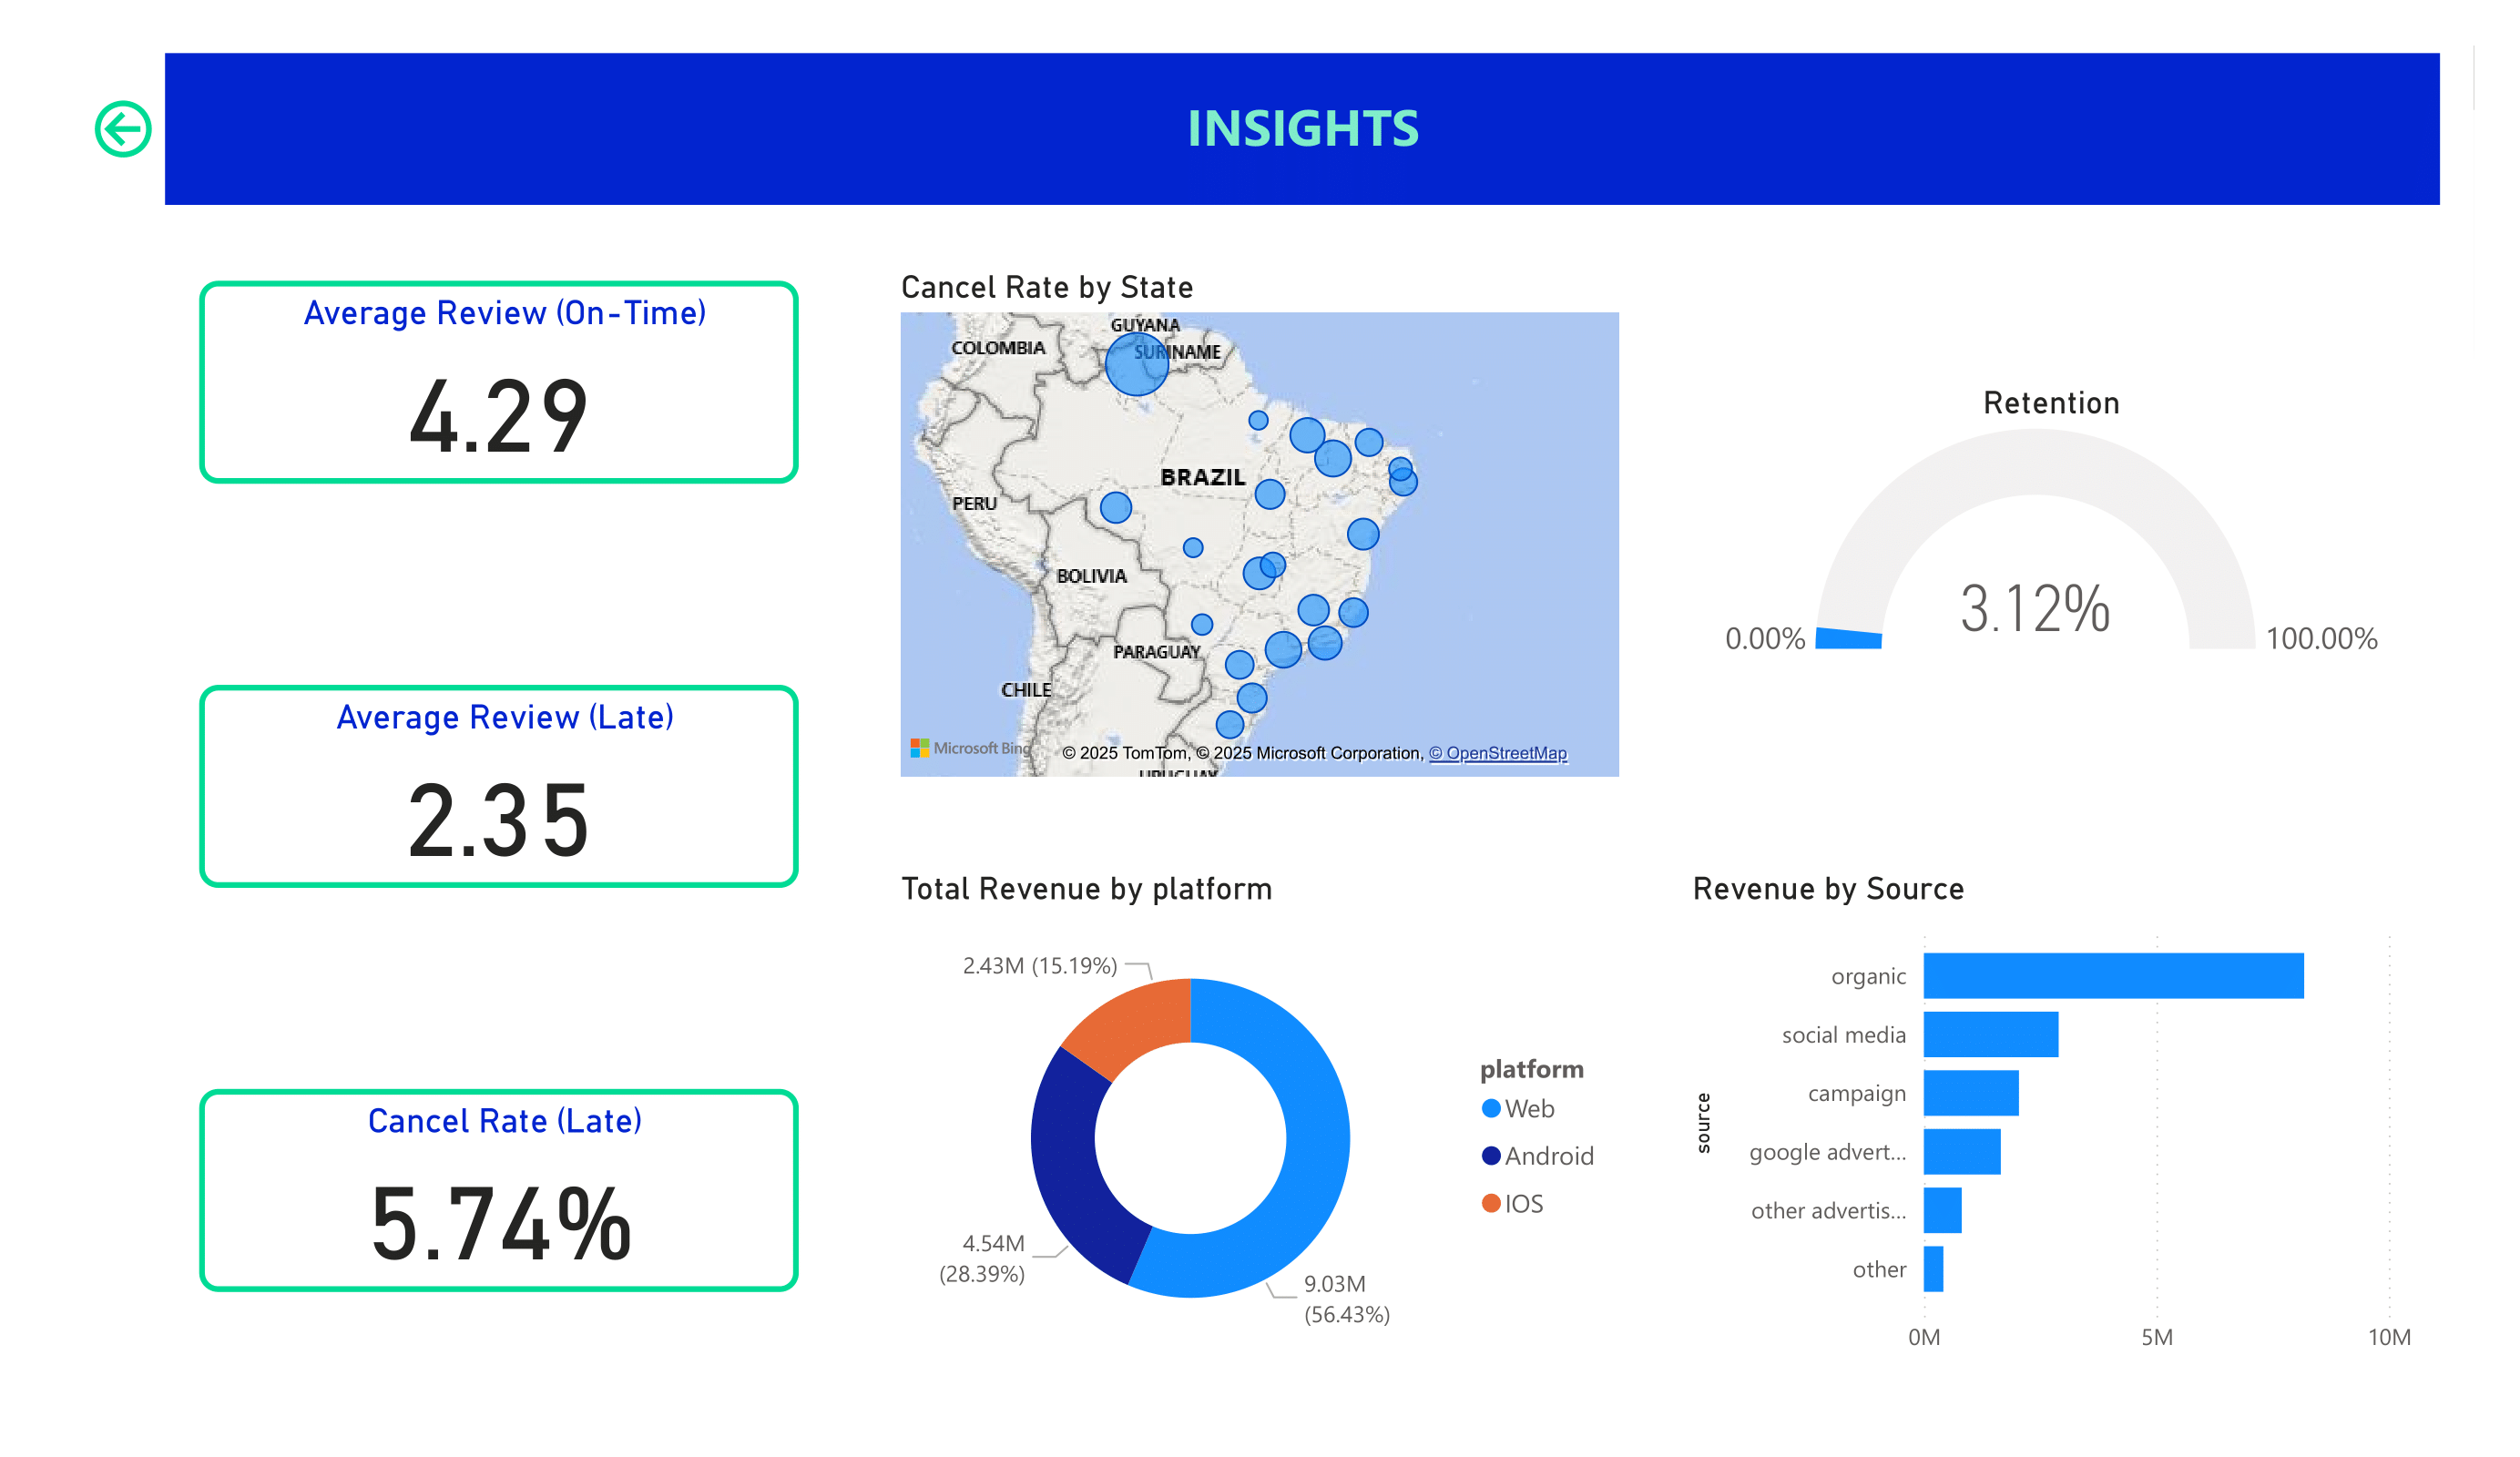
4. Insight Generation
Generated 3 actionable insights for executives:
- Delivery delays hurt customer satisfaction: late deliveries have much lower review scores and higher cancellations.
- Low customer retention: most customers buy once; repeat customers spend more and leave higher reviews.
- Paid channel inefficiency: paid ads drive traffic but with low conversion; organic/direct channels perform better.
Each insight includes business recommendations, e.g., improve SLA compliance, launch loyalty programs, and reallocate ad spend.
Business Impact
- Highlighted that improving on-time delivery and retention could directly boost revenue and satisfaction.
- Identified website optimization and ad spend reallocation opportunities.
- Provided executives with a data-driven health check of the company.
Deliverables
- Power BI PBIX file: Interactive dashboards with slicers and drill-through pages.
- Executive summary: Three main insights with recommended business actions.
- Data model: Cleaned and documented schema with proper relationships.
How to Use
- Clone or download the project.
- Open the
.pbix file in Power BI Desktop.
- Use the filters/slicers to explore data across:
- Time (month/year)
- Campaign periods
- Regions (states)
- Website sources/platforms
Technologies Used
- Power BI Desktop for ETL, modeling, visualization
- Power Query for data cleaning
- DAX for calculated measures (e.g., on-time %, repeat purchase rate, conversion)
- Kaggle Dataset: Olist Brazilian E-Commerce (public)
Images
Author
Project by Mark Hatala
LinkedIn | GitHub